Note
Access to this page requires authorization. You can try signing in or changing directories.
Access to this page requires authorization. You can try changing directories.
Note
Review the Application Insights SDK support guidance for our Classic API SDK support policy.
Caution
We recommend the Azure Monitor OpenTelemetry Distro for new applications or customers to power Azure Monitor Application Insights. The Azure Monitor OpenTelemetry Distro delivers a similar functionality and experience as the Application Insights SDK. It's possible to migrate from the Application Insights SDK using the migration guides for .NET, Node.js, and Python, but we are still working to add a few more features for backwards compatibility.
Application Insights monitors your components after deployment to discover performance and other issues. You can use Application Insights for Node.js services that are hosted in your datacenter, Azure VMs and web apps, and even in other public clouds.
To receive, store, and explore your monitoring data, include the SDK in your code. Then set up a corresponding Application Insights resource in Azure. The SDK sends data to that resource for further analysis and exploration.
The Node.js client library can automatically monitor incoming and outgoing HTTP requests, exceptions, and some system metrics. Beginning in version 0.20, the client library also can monitor some common third-party packages, like MongoDB, MySQL, and Redis.
All events related to an incoming HTTP request are correlated for faster troubleshooting.
You can use the TelemetryClient API to manually instrument and monitor more aspects of your app and system. We describe the TelemetryClient API in more detail later in this article.
Get started
Complete the following tasks to set up monitoring for an app or service.
Prerequisites
Before you begin, make sure that you have an Azure subscription, or get a new one for free. If your organization already has an Azure subscription, an administrator can follow these instructions to add you to it.
Set up an Application Insights resource
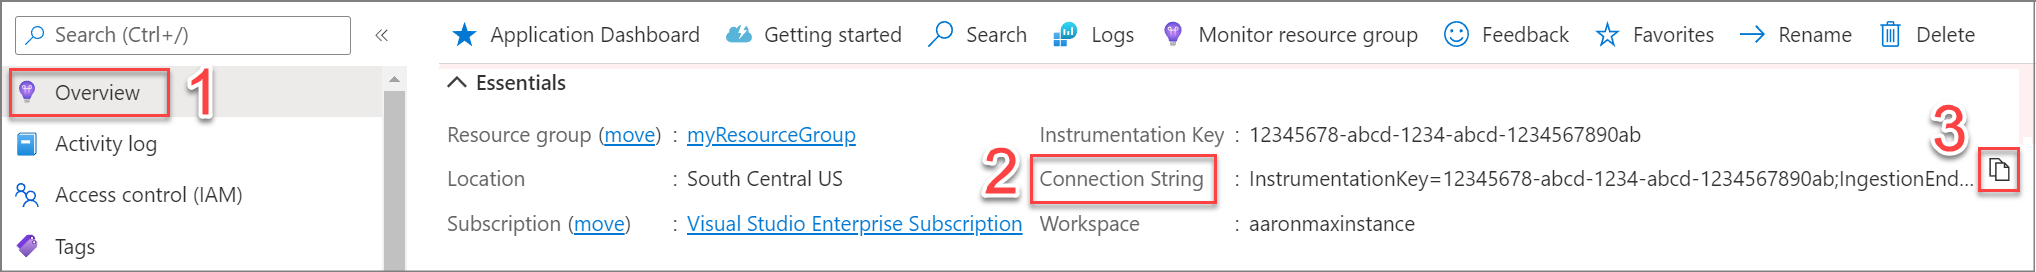
- Sign in to the Azure portal.
- Create an Application Insights resource.
Note
On March 31, 2025, support for instrumentation key ingestion will end. Instrumentation key ingestion will continue to work, but we'll no longer provide updates or support for the feature. Transition to connection strings to take advantage of new capabilities.
Set up the Node.js client library
Include the SDK in your app so that it can gather data.
Copy your resource's connection string from your new resource. Application Insights uses the connection string to map data to your Azure resource. Before the SDK can use your connection string, you must specify the connection string in an environment variable or in your code.
Add the Node.js client library to your app's dependencies via
package.json. From the root folder of your app, run:npm install applicationinsights --saveNote
If you're using TypeScript, don't install separate "typings" packages. This NPM package contains built-in typings.
Explicitly load the library in your code. Because the SDK injects instrumentation into many other libraries, load the library as early as possible, even before other
requirestatements.let appInsights = require('applicationinsights');You also can provide a connection string via the environment variable
APPLICATIONINSIGHTS_CONNECTION_STRING, instead of passing it manually tosetup()ornew appInsights.TelemetryClient(). This practice lets you keep connection strings out of committed source code, and you can specify different connection strings for different environments. To manually configure, callappInsights.setup('[your connection string]');.For more configuration options, see the following sections.
You can try the SDK without sending telemetry by setting
appInsights.defaultClient.config.disableAppInsights = true.Start automatically collecting and sending data by calling
appInsights.start();.

Note
As part of using Application Insights instrumentation, we collect and send diagnostic data to Microsoft. This data helps us run and improve Application Insights. You have the option to disable non-essential data collection. Learn more.
Monitor your app
The SDK automatically gathers telemetry about the Node.js runtime and some common third-party modules. Use your application to generate some of this data.
Then, in the Azure portal go to the Application Insights resource that you created earlier. In the Overview timeline, look for your first few data points. To see more detailed data, select different components in the charts.
To view the topology that's discovered for your app, you can use Application Map.
No data
Because the SDK batches data for submission, there might be a delay before items appear in the portal. If you don't see data in your resource, try some of the following fixes:
- Continue to use the application. Take more actions to generate more telemetry.
- Select Refresh in the portal resource view. Charts periodically refresh on their own, but manually refreshing forces them to refresh immediately.
- Verify that required outgoing ports are open.
- Use Search to look for specific events.
- Check the FAQ.
Basic usage
For out-of-the-box collection of HTTP requests, popular third-party library events, unhandled exceptions, and system metrics:
let appInsights = require("applicationinsights");
appInsights.setup("[your connection string]").start();
Note
If the connection string is set in the environment variable APPLICATIONINSIGHTS_CONNECTION_STRING, .setup() can be called with no arguments. This makes it easy to use different connection strings for different environments.
Load the Application Insights library require("applicationinsights") as early as possible in your scripts before you load other packages. This step is needed so that the Application Insights library can prepare later packages for tracking. If you encounter conflicts with other libraries doing similar preparation, try loading the Application Insights library afterwards.
Because of the way JavaScript handles callbacks, more work is necessary to track a request across external dependencies and later callbacks. By default, this extra tracking is enabled. Disable it by calling setAutoDependencyCorrelation(false) as described in the SDK configuration section.
Migrate from versions prior to 0.22
There are breaking changes between releases prior to version 0.22 and after. These changes are designed to bring consistency with other Application Insights SDKs and allow future extensibility.
In general, you can migrate with the following actions:
- Replace references to
appInsights.clientwithappInsights.defaultClient. - Replace references to
appInsights.getClient()withnew appInsights.TelemetryClient(). - Replace all arguments to client.track* methods with a single object containing named properties as arguments. See your IDE's built-in type hinting or TelemetryTypes for the excepted object for each type of telemetry.
If you access SDK configuration functions without chaining them to appInsights.setup(), you can now find these functions at appInsights.Configurations. An example is appInsights.Configuration.setAutoCollectDependencies(true). Review the changes to the default configuration in the next section.
SDK configuration
The appInsights object provides many configuration methods. They're listed in the following snippet with their default values.
let appInsights = require("applicationinsights");
appInsights.setup("<connection_string>")
    .setAutoDependencyCorrelation(true)
    .setAutoCollectRequests(true)
    .setAutoCollectPerformance(true, true)
    .setAutoCollectExceptions(true)
    .setAutoCollectDependencies(true)
    .setAutoCollectConsole(true)
    .setUseDiskRetryCaching(true)
    .setSendLiveMetrics(false)
    .setDistributedTracingMode(appInsights.DistributedTracingModes.AI)
    .start();
To fully correlate events in a service, be sure to set .setAutoDependencyCorrelation(true). With this option set, the SDK can track context across asynchronous callbacks in Node.js.
Review their descriptions in your IDE's built-in type hinting or applicationinsights.ts for detailed information and optional secondary arguments.
Note
By default, setAutoCollectConsole is configured to exclude calls to console.log and other console methods. Only calls to supported third-party loggers (for example, winston and bunyan) will be collected. You can change this behavior to include calls to console methods by using setAutoCollectConsole(true, true).
Distributed tracing
Modern cloud and microservices architectures have enabled simple, independently deployable services that reduce costs while increasing availability and throughput. However, it has made overall systems more difficult to reason about and debug. Distributed tracing solves this problem by providing a performance profiler that works like call stacks for cloud and microservices architectures.
Azure Monitor provides two experiences for consuming distributed trace data: the transaction diagnostics view for a single transaction/request and the application map view to show how systems interact.
Application Insights can monitor each component separately and detect which component is responsible for failures or performance degradation by using distributed telemetry correlation. This article explains the data model, context-propagation techniques, protocols, and implementation of correlation tactics on different languages and platforms used by Application Insights.
Enable distributed tracing via Application Insights through autoinstrumentation or SDKs
The Application Insights agents and SDKs for .NET, .NET Core, Java, Node.js, and JavaScript all support distributed tracing natively.
With the proper Application Insights SDK installed and configured, tracing information is automatically collected for popular frameworks, libraries, and technologies by SDK dependency autocollectors. The full list of supported technologies is available in the Dependency autocollection documentation.
Any technology also can be tracked manually with a call to TrackDependency on the TelemetryClient.
Data model for telemetry correlation
Application Insights defines a data model for distributed telemetry correlation. To associate telemetry with a logical operation, every telemetry item has a context field called operation_Id. Every telemetry item in the distributed trace shares this identifier. So even if you lose telemetry from a single layer, you can still associate telemetry reported by other components.
A distributed logical operation typically consists of a set of smaller operations that are requests processed by one of the components. Request telemetry defines these operations. Every request telemetry item has its own id that identifies it uniquely and globally. And all telemetry items (such as traces and exceptions) that are associated with the request should set the operation_parentId to the value of the request id.
Dependency telemetry represents every outgoing operation, such as an HTTP call to another component. It also defines its own id that's globally unique. Request telemetry, initiated by this dependency call, uses this id as its operation_parentId.
You can build a view of the distributed logical operation by using operation_Id, operation_parentId, and request.id with dependency.id. These fields also define the causality order of telemetry calls.
In a microservices environment, traces from components can go to different storage items. Every component can have its own connection string in Application Insights. To get telemetry for the logical operation, Application Insights queries data from every storage item.
When the number of storage items is large, you need a hint about where to look next. The Application Insights data model defines two fields to solve this problem: request.source and dependency.target. The first field identifies the component that initiated the dependency request. The second field identifies which component returned the response of the dependency call.
For information on querying from multiple disparate instances, see Query data across Log Analytics workspaces, applications, and resources in Azure Monitor.
Example
Let's look at an example. An application called Stock Prices shows the current market price of a stock by using an external API called Stock. The Stock Prices application has a page called Stock page that the client web browser opens by using GET /Home/Stock. The application queries the Stock API by using the HTTP call GET /api/stock/value.
You can analyze the resulting telemetry by running a query:
(requests | union dependencies | union pageViews)
| where operation_Id == "STYz"
| project timestamp, itemType, name, id, operation_ParentId, operation_Id
In the results, all telemetry items share the root operation_Id. When an Ajax call is made from the page, a new unique ID (qJSXU) is assigned to the dependency telemetry, and the ID of the pageView is used as operation_ParentId. The server request then uses the Ajax ID as operation_ParentId.
| itemType | name | ID | operation_ParentId | operation_Id |
|---|---|---|---|---|
| pageView | Stock page | STYz |
STYz |
|
| dependency | GET /Home/Stock | qJSXU |
STYz |
STYz |
| request | GET Home/Stock | KqKwlrSt9PA= |
qJSXU |
STYz |
| dependency | GET /api/stock/value | bBrf2L7mm2g= |
KqKwlrSt9PA= |
STYz |
When the call GET /api/stock/value is made to an external service, you need to know the identity of that server so you can set the dependency.target field appropriately. When the external service doesn't support monitoring, target is set to the host name of the service. An example is stock-prices-api.com. But if the service identifies itself by returning a predefined HTTP header, target contains the service identity that allows Application Insights to build a distributed trace by querying telemetry from that service.
Correlation headers using W3C TraceContext
Application Insights is transitioning to W3C Trace-Context, which defines:
traceparent: Carries the globally unique operation ID and unique identifier of the call.tracestate: Carries system-specific tracing context.
The latest version of the Application Insights SDK supports the Trace-Context protocol, but you might need to opt in to it. (Backward compatibility with the previous correlation protocol supported by the Application Insights SDK is maintained.)
The correlation HTTP protocol, also called Request-Id, is being deprecated. This protocol defines two headers:
Request-Id: Carries the globally unique ID of the call.Correlation-Context: Carries the name-value pairs collection of the distributed trace properties.
Application Insights also defines the extension for the correlation HTTP protocol. It uses Request-Context name-value pairs to propagate the collection of properties used by the immediate caller or callee. The Application Insights SDK uses this header to set the dependency.target and request.source fields.
The W3C Trace-Context and Application Insights data models map in the following way:
| Application Insights | W3C TraceContext |
|---|---|
Id of Request and Dependency |
parent-id |
Operation_Id |
trace-id |
Operation_ParentId |
parent-id of this span's parent span. This field must be empty if it's a root span. |
For more information, see Application Insights telemetry data model.
Sampling
By default, the SDK sends all collected data to the Application Insights service. If you want to enable sampling to reduce the amount of data, set the samplingPercentage field on the config object of a client. Setting samplingPercentage to 100 (the default) means all data will be sent, and 0 means nothing will be sent.
If you're using automatic correlation, all data associated with a single request is included or excluded as a unit.
Add code such as the following to enable sampling:
const appInsights = require("applicationinsights");
appInsights.setup("<connection_string>");
appInsights.defaultClient.config.samplingPercentage = 33; // 33% of all telemetry will be sent to Application Insights
appInsights.start();
Multiple roles for multi-component applications
In some scenarios, your application might consist of multiple components that you want to instrument all with the same connection string. You want to still see these components as separate units in the portal, as if they were using separate connection strings. An example is separate nodes on Application Map. You need to manually configure the RoleName field to distinguish one component's telemetry from other components that send data to your Application Insights resource.
Use the following code to set the RoleName field:
const appInsights = require("applicationinsights");
appInsights.setup("<connection_string>");
appInsights.defaultClient.context.tags[appInsights.defaultClient.context.keys.cloudRole] = "MyRoleName";
appInsights.start();
Browser SDK Loader
Note
Available as a public preview. Supplemental Terms of Use for Microsoft Azure Previews
Automatic web Instrumentation can be enabled for node server via JavaScript (Web) SDK Loader Script injection by configuration.
let appInsights = require("applicationinsights");
appInsights.setup("<connection_string>")
    .enableWebInstrumentation(true)
    .start();
or by setting environment variable APPLICATIONINSIGHTS_WEB_INSTRUMENTATION_ENABLED = true.
Web Instrumentation is enabled on node server responses when all of the following requirements are met:
- Response has status code
200. - Response method is
GET. - Server response has
Content-Typehtml. - Server response contains both
<head>and</head>Tags. - If response is compressed, it must have only one
Content-Encodingtype, and encoding type must be one ofgzip,brordeflate. - Response does not contain current /backup web Instrumentation CDN endpoints. (current and backup Web Instrumentation CDN endpoints here)
Web Instrumentation CDN endpoint can be changed by setting environment variable APPLICATIONINSIGHTS_WEB_INSTRUMENTATION_SOURCE = "web Instrumentation CDN endpoints".
Web Instrumentation connection string can be changed by setting environment variable APPLICATIONINSIGHTS_WEB_INSTRUMENTATION_CONNECTION_STRING = "web Instrumentation connection string"
Note
Web Instrumentation may slow down server response time, especially when response size is large or response is compressed. For the case in which some middle layers are applied, it may result in web Instrumentation not working and original response will be returned.
Automatic third-party instrumentation
To track context across asynchronous calls, some changes are required in third-party libraries, such as MongoDB and Redis. By default, Application Insights uses diagnostic-channel-publishers to monkey-patch some of these libraries. This feature can be disabled by setting the APPLICATION_INSIGHTS_NO_DIAGNOSTIC_CHANNEL environment variable.
Note
By setting that environment variable, events might not be correctly associated with the right operation.
Individual monkey patches can be disabled by setting the APPLICATION_INSIGHTS_NO_PATCH_MODULES environment variable to a comma-separated list of packages to disable. For example, use APPLICATION_INSIGHTS_NO_PATCH_MODULES=console,redis to avoid patching the console and redis packages.
Currently, nine packages are instrumented: bunyan,console,mongodb,mongodb-core,mysql,redis,winston,pg, and pg-pool. For information about exactly which version of these packages are patched, see the diagnostic-channel-publishers' README.
The bunyan, winston, and console patches generate Application Insights trace events based on whether setAutoCollectConsole is enabled. The rest generates Application Insights dependency events based on whether setAutoCollectDependencies is enabled.
Live metrics
To enable sending live metrics from your app to Azure, use setSendLiveMetrics(true). Currently, filtering of live metrics in the portal isn't supported.
Extended metrics
Note
The ability to send extended native metrics was added in version 1.4.0.
To enable sending extended native metrics from your app to Azure, install the separate native metrics package. The SDK automatically loads when it's installed and start collecting Node.js native metrics.
npm install applicationinsights-native-metrics
Currently, the native metrics package performs autocollection of garbage collection CPU time, event loop ticks, and heap usage:
- Garbage collection: The amount of CPU time spent on each type of garbage collection, and how many occurrences of each type.
- Event loop: How many ticks occurred and how much CPU time was spent in total.
- Heap vs. non-heap: How much of your app's memory usage is in the heap or non-heap.
Distributed tracing modes
By default, the SDK sends headers understood by other applications or services instrumented with an Application Insights SDK. You can enable sending and receiving of W3C Trace Context headers in addition to the existing AI headers. In this way, you won't break correlation with any of your existing legacy services. Enabling W3C headers allows your app to correlate with other services not instrumented with Application Insights but that do adopt this W3C standard.
const appInsights = require("applicationinsights");
appInsights
  .setup("<your connection string>")
  .setDistributedTracingMode(appInsights.DistributedTracingModes.AI_AND_W3C)
  .start()
TelemetryClient API
For a full description of the TelemetryClient API, see Application Insights API for custom events and metrics.
You can track any request, event, metric, or exception by using the Application Insights client library for Node.js. The following code example demonstrates some of the APIs that you can use:
let appInsights = require("applicationinsights");
appInsights.setup().start(); // assuming connection string in env var. start() can be omitted to disable any non-custom data
let client = appInsights.defaultClient;
client.trackEvent({name: "my custom event", properties: {customProperty: "custom property value"}});
client.trackException({exception: new Error("handled exceptions can be logged with this method")});
client.trackMetric({name: "custom metric", value: 3});
client.trackTrace({message: "trace message"});
client.trackDependency({target:"http://dbname", name:"select customers proc", data:"SELECT * FROM Customers", duration:231, resultCode:0, success: true, dependencyTypeName: "ZSQL"});
client.trackRequest({name:"GET /customers", url:"http://myserver/customers", duration:309, resultCode:200, success:true});

let http = require("http");
http.createServer( (req, res) => {
  client.trackNodeHttpRequest({request: req, response: res}); // Place at the beginning of your request handler
});
Track your dependencies
Use the following code to track your dependencies:
let appInsights = require("applicationinsights");
let client = new appInsights.TelemetryClient();

var success = false;
let startTime = Date.now();
// execute dependency call here....
let duration = Date.now() - startTime;
success = true;

client.trackDependency({target:"http://dbname", name:"select customers proc", data:"SELECT * FROM Customers", duration:duration, resultCode:0, success: true, dependencyTypeName: "ZSQL"});;
An example utility using trackMetric to measure how long event loop scheduling takes:
function startMeasuringEventLoop() {
  var startTime = process.hrtime();
  var sampleSum = 0;
  var sampleCount = 0;

  // Measure event loop scheduling delay
  setInterval(() => {
    var elapsed = process.hrtime(startTime);
    startTime = process.hrtime();
    sampleSum += elapsed[0] * 1e9 + elapsed[1];
    sampleCount++;
  }, 0);

  // Report custom metric every second
  setInterval(() => {
    var samples = sampleSum;
    var count = sampleCount;
    sampleSum = 0;
    sampleCount = 0;

    if (count > 0) {
      var avgNs = samples / count;
      var avgMs = Math.round(avgNs / 1e6);
      client.trackMetric({name: "Event Loop Delay", value: avgMs});
    }
  }, 1000);
}
Add a custom property to all events
Use the following code to add a custom property to all events:
appInsights.defaultClient.commonProperties = {
  environment: process.env.SOME_ENV_VARIABLE
};
Track HTTP GET requests
Use the following code to manually track HTTP GET requests:
Note
- All requests are tracked by default. To disable automatic collection, call
.setAutoCollectRequests(false)before callingstart(). - Native fetch API requests aren't automatically tracked by classic Application Insights; manual dependency tracking is required.
appInsights.defaultClient.trackRequest({name:"GET /customers", url:"http://myserver/customers", duration:309, resultCode:200, success:true});
Alternatively, you can track requests by using the trackNodeHttpRequest method:
var server = http.createServer((req, res) => {
  if ( req.method === "GET" ) {
      appInsights.defaultClient.trackNodeHttpRequest({request:req, response:res});
  }
  // other work here....
  res.end();
});
Track server startup time
Use the following code to track server startup time:
let start = Date.now();
server.on("listening", () => {
  let duration = Date.now() - start;
  appInsights.defaultClient.trackMetric({name: "server startup time", value: duration});
});
Flush
By default, telemetry is buffered for 15 seconds before it's sent to the ingestion server. If your application has a short lifespan, such as a CLI tool, it might be necessary to manually flush your buffered telemetry when the application terminates by using appInsights.defaultClient.flush().
If the SDK detects that your application is crashing, it calls flush for you by using appInsights.defaultClient.flush({ isAppCrashing: true }). With the flush option isAppCrashing, your application is assumed to be in an abnormal state and isn't suitable to send telemetry. Instead, the SDK saves all buffered telemetry to persistent storage and lets your application terminate. When your application starts again, it tries to send any telemetry that was saved to persistent storage.
Filter and preprocess telemetry
You can write code to filter, modify, or enrich your telemetry before it's sent from the SDK. The processing includes data that's sent from the standard telemetry modules, such as HTTP request collection and dependency collection.
Filtering can modify or discard telemetry before it's sent from the SDK by implementing
ITelemetryProcessor. For example, you could reduce the volume of telemetry by excluding requests from robots. Unlike sampling, You have full control over what is sent or discarded, but it affects any metrics based on aggregated logs. Depending on how you discard items, you might also lose the ability to navigate between related items.Add or Modify properties to any telemetry sent from your app by implementing an
ITelemetryInitializer. For example, you could add calculated values or version numbers by which to filter the data in the portal.Sampling reduces the volume of telemetry without affecting your statistics. It keeps together related data points so that you can navigate between them when you diagnose a problem. In the portal, the total counts are multiplied to compensate for the sampling.
Note
The SDK API is used to send custom events and metrics.
Filtering
This technique gives you direct control over what's included or excluded from the telemetry stream. Filtering can be used to drop telemetry items from being sent to Application Insights. You can use filtering with sampling, or separately.
To filter telemetry, you write a telemetry processor and register it with TelemetryConfiguration. All telemetry goes through your processor. You can choose to drop it from the stream or give it to the next processor in the chain. Telemetry from the standard modules, such as the HTTP request collector and the dependency collector, and telemetry you tracked yourself is included. For example, you can filter out telemetry about requests from robots or successful dependency calls.
Warning
Filtering the telemetry sent from the SDK by using processors can skew the statistics that you see in the portal and make it difficult to follow related items.
Instead, consider using sampling.
ITelemetryProcessor and ITelemetryInitializer
What's the difference between telemetry processors and telemetry initializers?
- There are some overlaps in what you can do with them. Both can be used to add or modify properties of telemetry, although we recommend that you use initializers for that purpose.
- Telemetry initializers always run before telemetry processors.
- Telemetry initializers may be called more than once. By convention, they don't set any property that was already set.
- Telemetry processors allow you to completely replace or discard a telemetry item.
- All registered telemetry initializers are called for every telemetry item. For telemetry processors, SDK guarantees calling the first telemetry processor. Whether the rest of the processors are called or not is decided by the preceding telemetry processors.
- Use telemetry initializers to enrich telemetry with more properties or override an existing one. Use a telemetry processor to filter out telemetry.
Add/modify properties
Use telemetry initializers to enrich telemetry with additional information or to override telemetry properties set by the standard telemetry modules.
For example, Application Insights for a web package collects telemetry about HTTP requests. By default, it flags any request with a response code >=400 as failed. If instead you want to treat 400 as a success, you can provide a telemetry initializer that sets the success property.
If you provide a telemetry initializer, it's called whenever any of the Track*() methods are called. This initializer includes Track() methods called by the standard telemetry modules. By convention, these modules don't set any property that was already set by an initializer. Telemetry initializers are called before calling telemetry processors, so any enrichments done by initializers are visible to processors.
Preprocess data with telemetry processors
You can process and filter collected data before it's sent for retention by using telemetry processors. Telemetry processors are called one by one in the order they were added before the telemetry item is sent to the cloud.
public addTelemetryProcessor(telemetryProcessor: (envelope: Contracts.Envelope, context: { http.RequestOptions, http.ClientRequest, http.ClientResponse, correlationContext }) => boolean)
If a telemetry processor returns false, that telemetry item isn't sent.
All telemetry processors receive the telemetry data and its envelope to inspect and modify. They also receive a context object. The contents of this object are defined by the contextObjects parameter when calling a track method for manually tracked telemetry. For automatically collected telemetry, this object is filled with available request information and the persistent request content as provided by appInsights.getCorrelationContext() (if automatic dependency correlation is enabled).
The TypeScript type for a telemetry processor is:
telemetryProcessor: (envelope: ContractsModule.Contracts.Envelope, context: { http.RequestOptions, http.ClientRequest, http.ClientResponse, correlationContext }) => boolean;
For example, a processor that removes stacks trace data from exceptions might be written and added as follows:
function removeStackTraces ( envelope, context ) {
  if (envelope.data.baseType === "Microsoft.ApplicationInsights.ExceptionData") {
    var data = envelope.data.baseData;
    if (data.exceptions && data.exceptions.length > 0) {
      for (var i = 0; i < data.exceptions.length; i++) {
        var exception = data.exceptions[i];
        exception.parsedStack = null;
        exception.hasFullStack = false;
      }
    }
  }
  return true;
}

appInsights.defaultClient.addTelemetryProcessor(removeStackTraces);
Use multiple connection strings
You can create multiple Application Insights resources and send different data to each by using their respective connection strings.
For example:
let appInsights = require("applicationinsights");

// configure auto-collection under one connection string
appInsights.setup("Connection String A").start();

// track some events manually under another connection string
let otherClient = new appInsights.TelemetryClient("Connection String B");
otherClient.trackEvent({name: "my custom event"});
Advanced configuration options
The client object contains a config property with many optional settings for advanced scenarios. To set them, use:
client.config.PROPERTYNAME = VALUE;
These properties are client specific, so you can configure appInsights.defaultClient separately from clients created with new appInsights.TelemetryClient().
| Property | Description |
|---|---|
| connectionString | An identifier for your Application Insights resource. |
| endpointUrl | The ingestion endpoint to send telemetry payloads to. |
| quickPulseHost | The Live Metrics Stream host to send live metrics telemetry to. |
| proxyHttpUrl | A proxy server for SDK HTTP traffic. (Optional. Default is pulled from http_proxy environment variable.) |
| proxyHttpsUrl | A proxy server for SDK HTTPS traffic. (Optional. Default is pulled from https_proxy environment variable.) |
| httpAgent | An http.Agent to use for SDK HTTP traffic. (Optional. Default is undefined.) |
| httpsAgent | An https.Agent to use for SDK HTTPS traffic. (Optional. Default is undefined.) |
| maxBatchSize | The maximum number of telemetry items to include in a payload to the ingestion endpoint. (Default is 250.) |
| maxBatchIntervalMs | The maximum amount of time to wait for a payload to reach maxBatchSize. (Default is 15000.) |
| disableAppInsights | A flag indicating if telemetry transmission is disabled. (Default is false.) |
| samplingPercentage | The percentage of telemetry items tracked that should be transmitted. (Default is 100.) |
| correlationIdRetryIntervalMs | The time to wait before retrying to retrieve the ID for cross-component correlation. (Default is 30000.) |
| correlationHeaderExcludedDomains | A list of domains to exclude from cross-component correlation header injection. (Default. See Config.ts.) |
Core API for custom events and metrics
Insert a few lines of code in your application to find out what users are doing with it, or to help diagnose issues. You can send telemetry from device and desktop apps, web clients, and web servers. Use the Application Insights core telemetry API to send custom events and metrics and your own versions of standard telemetry. This API is the same API that the standard Application Insights data collectors use.
API summary
The core API is uniform across all platforms, apart from a few variations like GetMetric (.NET only).
| Method | Used for |
|---|---|
TrackPageView |
Pages, screens, panes, or forms. |
TrackEvent |
User actions and other events. Used to track user behavior or to monitor performance. |
GetMetric |
Zero and multidimensional metrics, centrally configured aggregation, C# only. |
TrackMetric |
Performance measurements such as queue lengths not related to specific events. |
TrackException |
Logging exceptions for diagnosis. Trace where they occur in relation to other events and examine stack traces. |
TrackRequest |
Logging the frequency and duration of server requests for performance analysis. |
TrackTrace |
Resource Diagnostic log messages. You can also capture third-party logs. |
TrackDependency |
Logging the duration and frequency of calls to external components that your app depends on. |
You can attach properties and metrics to most of these telemetry calls.
Prerequisites
If you don't have a reference on Application Insights SDK yet:
Add the Application Insights SDK to your project.
In your device or web server code, include:
Get a TelemetryClient instance
Get an instance of TelemetryClient:
Note
If you use Azure Functions v2+ or Azure WebJobs v3+, see Monitor Azure Functions.
Note
For ASP.NET Core apps and Non-HTTP/Worker for .NET/.NET Core apps, get an instance of TelemetryClient from the dependency injection container as explained in their respective documentation.
private TelemetryClient telemetry = new TelemetryClient();
If you see a message that tells you this method is obsolete, see microsoft/ApplicationInsights-dotnet#1152 for more information.
Incoming HTTP requests are automatically captured. You might want to create more instances of TelemetryClient for other modules of your app. For example, you might have one TelemetryClient instance in your middleware class to report business logic events. You can set properties such as UserId and DeviceId to identify the machine. This information is attached to all events that the instance sends.
TelemetryClient.Context.User.Id = "...";
TelemetryClient.Context.Device.Id = "...";
Note
TelemetryClient is thread safe.
TrackEvent
In Application Insights, a custom event is a data point that you can display in Metrics Explorer as an aggregated count and in Diagnostic Search as individual occurrences. (It isn't related to MVC or other framework "events.")
Insert TrackEvent calls in your code to count various events. For example, you might want to track how often users choose a particular feature. Or you might want to know how often they achieve certain goals or make specific types of mistakes.
For example, in a game app, send an event whenever a user wins the game:
Custom events in Log Analytics
The telemetry is available in the customEvents table on the Application Insights Logs tab or usage experience. Events might come from trackEvent(..) or the Click Analytics Autocollection plug-in.
If sampling is in operation, the itemCount property shows a value greater than 1. For example, itemCount==10 means that of 10 calls to trackEvent(), the sampling process transmitted only one of them. To get a correct count of custom events, use code such as customEvents | summarize sum(itemCount).
Note
itemCount has a minimum value of one; the record itself represents an entry.
GetMetric
To learn how to effectively use the GetMetric() call to capture locally preaggregated metrics for .NET and .NET Core applications, see Custom metric collection in .NET and .NET Core.
TrackMetric
Note
Microsoft.ApplicationInsights.TelemetryClient.TrackMetric isn't the preferred method for sending metrics. Metrics should always be preaggregated across a time period before being sent. Use one of the GetMetric(..) overloads to get a metric object for accessing SDK preaggregation capabilities.
If you're implementing your own preaggregation logic, you can use the TrackMetric() method to send the resulting aggregates. If your application requires sending a separate telemetry item on every occasion without aggregation across time, you likely have a use case for event telemetry. See TelemetryClient.TrackEvent(Microsoft.ApplicationInsights.DataContracts.EventTelemetry).
Application Insights can chart metrics that aren't attached to particular events. For example, you could monitor a queue length at regular intervals. With metrics, the individual measurements are of less interest than the variations and trends, and so statistical charts are useful.
To send metrics to Application Insights, you can use the TrackMetric(..) API. There are two ways to send a metric:
Single value. Every time you perform a measurement in your application, you send the corresponding value to Application Insights.
For example, assume you have a metric that describes the number of items in a container. During a particular time period, you first put three items into the container and then you remove two items. Accordingly, you would call
TrackMetrictwice. First, you would pass the value3and then pass the value-2. Application Insights stores both values for you.Aggregation. When you work with metrics, every single measurement is rarely of interest. Instead, a summary of what happened during a particular time period is important. Such a summary is called aggregation.
In the preceding example, the aggregate metric sum for that time period is
1and the count of the metric values is2. When you use the aggregation approach, you invokeTrackMetriconly once per time period and send the aggregate values. We recommend this approach because it can significantly reduce the cost and performance overhead by sending fewer data points to Application Insights, while still collecting all relevant information.
Single value examples
To send a single metric value:
var sample = new MetricTelemetry();
sample.Name = "queueLength";
sample.Sum = 42.3;
telemetryClient.TrackMetric(sample);
Custom metrics in Log Analytics
The telemetry is available in the customMetrics table in Application Insights Analytics. Each row represents a call to trackMetric(..) in your app.
valueSum: The sum of the measurements. To get the mean value, divide byvalueCount.valueCount: The number of measurements that were aggregated into thistrackMetric(..)call.
Note
valueCount has a minimum value of one; the record itself represents an entry.
Page views
In a device or webpage app, page view telemetry is sent by default when each screen or page is loaded. But you can change the default to track page views at more or different times. For example, in an app that displays tabs or panes, you might want to track a page whenever the user opens a new pane.
User and session data is sent as properties along with page views, so the user and session charts come alive when there's page view telemetry.
Custom page views
Page telemetry in Log Analytics
In Log Analytics, two tables show data from browser operations:
pageViews: Contains data about the URL and page title.browserTimings: Contains data about client performance like the time taken to process the incoming data.
To find how long the browser takes to process different pages:
browserTimings
| summarize avg(networkDuration), avg(processingDuration), avg(totalDuration) by name
To discover the popularity of different browsers:
pageViews
| summarize count() by client_Browser
To associate page views to AJAX calls, join with dependencies:
pageViews
| join (dependencies) on operation_Id
TrackRequest
The server SDK uses TrackRequest to log HTTP requests.
You can also call it yourself if you want to simulate requests in a context where you don't have the web service module running.
The recommended way to send request telemetry is where the request acts as an operation context.
Operation context
You can correlate telemetry items together by associating them with operation context. The standard request-tracking module does it for exceptions and other events that are sent while an HTTP request is being processed. In Search and Analytics, you can easily find any events associated with the request by using its operation ID.
When you track telemetry manually, the easiest way to ensure telemetry correlation is by using this pattern:
// Establish an operation context and associated telemetry item:
using (var operation = telemetryClient.StartOperation<RequestTelemetry>("operationName"))
{
    // Telemetry sent in here uses the same operation ID.
    ...
    telemetryClient.TrackTrace(...); // or other Track* calls
    ...

    // Set properties of containing telemetry item--for example:
    operation.Telemetry.ResponseCode = "200";

    // Optional: explicitly send telemetry item:
    telemetryClient.StopOperation(operation);

} // When operation is disposed, telemetry item is sent.
For more information on correlation, see Telemetry correlation in Application Insights.
Along with setting an operation context, StartOperation creates a telemetry item of the type that you specify. It sends the telemetry item when you dispose of the operation or if you explicitly call StopOperation. If you use RequestTelemetry as the telemetry type, its duration is set to the timed interval between start and stop.
Telemetry items reported within a scope of operation become children of such an operation. Operation contexts could be nested.
In Search, the operation context is used to create the Related Items list.

For more information on custom operations tracking, see Track custom operations with Application Insights .NET SDK.
Requests in Log Analytics
In Application Insights Analytics, requests show up in the requests table.
If sampling is in operation, the itemCount property shows a value greater than 1. For example, itemCount==10 means that of 10 calls to trackRequest(), the sampling process transmitted only one of them. To get a correct count of requests and average duration segmented by request names, use code such as:
requests
| summarize count = sum(itemCount), avgduration = avg(duration) by name
TrackException
Send exceptions to Application Insights:
- To count them, as an indication of the frequency of a problem.
- To examine individual occurrences.
The reports include the stack traces.
The SDKs catch many exceptions automatically, so you don't always have to call TrackException explicitly.
Exceptions in Log Analytics
In Application Insights Analytics, exceptions show up in the exceptions table.
If sampling is in operation, the itemCount property shows a value greater than 1. For example, itemCount==10 means that of 10 calls to trackException(), the sampling process transmitted only one of them. To get a correct count of exceptions segmented by type of exception, use code such as:
exceptions
| summarize sum(itemCount) by type
Most of the important stack information is already extracted into separate variables, but you can pull apart the details structure to get more. Because this structure is dynamic, you should cast the result to the type you expect. For example:
exceptions
| extend method2 = tostring(details[0].parsedStack[1].method)
To associate exceptions with their related requests, use a join:
exceptions
| join (requests) on operation_Id
TrackTrace
Use TrackTrace to help diagnose problems by sending a "breadcrumb trail" to Application Insights. You can send chunks of diagnostic data and inspect them in Diagnostic Search.
In .NET Log adapters, use this API to send third-party logs to the portal.
telemetry.TrackTrace(message, SeverityLevel.Warning, properties);
Log a diagnostic event such as entering or leaving a method.
| Parameter | Description |
|---|---|
message |
Diagnostic data. Can be much longer than a name. |
properties |
Map of string to string. More data is used to filter exceptions in the portal. Defaults to empty. |
severityLevel |
Supported values: SeverityLevel.ts. |
You can search on message content, but unlike property values, you can't filter on it.
The size limit on message is much higher than the limit on properties. An advantage of TrackTrace is that you can put relatively long data in the message. For example, you can encode POST data there.
You can also add a severity level to your message. And, like other telemetry, you can add property values to help you filter or search for different sets of traces. For example:
var telemetry = new Microsoft.ApplicationInsights.TelemetryClient();
telemetry.TrackTrace("Slow database response",
                SeverityLevel.Warning,
                new Dictionary<string,string> { {"database", db.ID} });
In Search, you can then easily filter out all the messages of a particular severity level that relate to a particular database.
Traces in Log Analytics
In Application Insights Analytics, calls to TrackTrace show up in the traces table.
If sampling is in operation, the itemCount property shows a value greater than 1. For example, itemCount==10 means that of 10 calls to trackTrace(), the sampling process transmitted only one of them. To get a correct count of trace calls, use code such as traces | summarize sum(itemCount).
TrackDependency
Use the TrackDependency call to track the response times and success rates of calls to an external piece of code. The results appear in the dependency charts in the portal. The following code snippet must be added wherever a dependency call is made.
Note
For .NET and .NET Core, you can alternatively use the TelemetryClient.StartOperation (extension) method that fills the DependencyTelemetry properties that are needed for correlation and some other properties like the start time and duration, so you don't need to create a custom timer as with the following examples. For more information, see the section on outgoing dependency tracking in Track custom operations with Application Insights .NET SDK.
var success = false;
var startTime = DateTime.UtcNow;
var timer = System.Diagnostics.Stopwatch.StartNew();
try
{
    success = dependency.Call();
}
catch(Exception ex)
{
    success = false;
    telemetry.TrackException(ex);
    throw new Exception("Operation went wrong", ex);
}
finally
{
    timer.Stop();
    telemetry.TrackDependency("DependencyType", "myDependency", "myCall", startTime, timer.Elapsed, success);
}
Remember that the server SDKs include a dependency module that discovers and tracks certain dependency calls automatically, for example, to databases and REST APIs. You have to install an agent on your server to make the module work.
You use this call if you want to track calls that the automated tracking doesn't catch.
To turn off the standard dependency-tracking module in C#, edit ApplicationInsights.config and delete the reference to DependencyCollector.DependencyTrackingTelemetryModule.
Dependencies in Log Analytics
In Application Insights Analytics, trackDependency calls show up in the dependencies table.
If sampling is in operation, the itemCount property shows a value greater than 1. For example, itemCount==10 means that of 10 calls to trackDependency(), the sampling process transmitted only one of them. To get a correct count of dependencies segmented by target component, use code such as:
dependencies
| summarize sum(itemCount) by target
To associate dependencies with their related requests, use a join:
dependencies
| join (requests) on operation_Id
Flushing data
Normally, the SDK sends data at fixed intervals, typically 30 seconds, or whenever the buffer is full, which is typically 500 items. In some cases, you might want to flush the buffer. An example is if you're using the SDK in an application that shuts down.
When you use Flush(), we recommend this pattern:
telemetry.Flush();
// Allow some time for flushing before shutdown.
System.Threading.Thread.Sleep(5000);
When you use FlushAsync(), we recommend this pattern:
await telemetryClient.FlushAsync()
// No need to sleep
We recommend always flushing as part of the application shutdown to guarantee that telemetry isn't lost.
Note
Review Autoflush configuration: Enabling autoflush in your web.config file can lead to performance degradation in .NET applications instrumented with Application Insights. With autoflush enabled, every invocation of System.Diagnostics.Trace.Trace* methods results in individual telemetry items being sent as separate distinct web requests to the ingestion service. This can potentially cause network and storage exhaustion on your web servers. For enhanced performance, it's recommended to disable autoflush and also, utilize the ServerTelemetryChannel, designed for a more effective telemetry data transmission.
The function is asynchronous for the server telemetry channel.
Authenticated users
In a web app, users are identified by cookies by default. A user might be counted more than once if they access your app from a different machine or browser, or if they delete cookies.
If users sign in to your app, you can get a more accurate count by setting the authenticated user ID in the browser code. It isn't necessary to use the user's actual sign-in name. It only has to be an ID that's unique to that user. It must not include spaces or any of the characters ,;=|.
The user ID is also set in a session cookie and sent to the server. If the server SDK is installed, the authenticated user ID is sent as part of the context properties of both client and server telemetry. You can then filter and search on it.
If your app groups users into accounts, you can also pass an identifier for the account. The same character restrictions apply.
In Metrics Explorer, you can create a chart that counts Users, Authenticated, and User accounts.
You can also search for client data points with specific user names and accounts.
Note
The EnableAuthenticationTrackingJavaScript property in the ApplicationInsightsServiceOptions class in the .NET Core SDK simplifies the JavaScript configuration needed to inject the user name as the Auth ID for each trace sent by the Application Insights JavaScript SDK.
When this property is set to true, the user name from the user in the ASP.NET Core is printed along with client-side telemetry. For this reason, adding appInsights.setAuthenticatedUserContext manually isn't required anymore because it's already injected by the SDK for ASP.NET Core. The Auth ID is also sent to the server where the SDK in .NET Core identifies and uses it for any server-side telemetry, as described in the JavaScript API reference.
For JavaScript applications that don't work in the same way as ASP.NET Core MVC, such as SPA web apps, you still need to add appInsights.setAuthenticatedUserContext manually.
Filter, search, and segment your data by using properties
You can attach properties and measurements to your events, metrics, page views, exceptions, and other telemetry data.
Properties are string values that you can use to filter your telemetry in the usage reports. For example, if your app provides several games, you can attach the name of the game to each event so that you can see which games are more popular.
There's a limit of 8,192 on the string length. If you want to send large chunks of data, use the message parameter of TrackTrace.
Metrics are numeric values that can be presented graphically. For example, you might want to see if there's a gradual increase in the scores that your gamers achieve. The graphs can be segmented by the properties that are sent with the event so that you can get separate or stacked graphs for different games.
Metric values should be greater than or equal to 0 to display correctly.
There are some limits on the number of properties, property values, and metrics that you can use.
// Set up some properties and metrics:
var properties = new Dictionary <string, string>
    {{"game", currentGame.Name}, {"difficulty", currentGame.Difficulty}};
var metrics = new Dictionary <string, double>
    {{"Score", currentGame.Score}, {"Opponents", currentGame.OpponentCount}};

// Send the event:
telemetry.TrackEvent("WinGame", properties, metrics);
Important
Make sure you don't log personally identifiable information in properties.
Alternative way to set properties and metrics
If it's more convenient, you can collect the parameters of an event in a separate object:
var event = new EventTelemetry();

event.Name = "WinGame";
event.Metrics["processingTime"] = stopwatch.Elapsed.TotalMilliseconds;
event.Properties["game"] = currentGame.Name;
event.Properties["difficulty"] = currentGame.Difficulty;
event.Metrics["Score"] = currentGame.Score;
event.Metrics["Opponents"] = currentGame.Opponents.Length;

telemetry.TrackEvent(event);
Warning
Don't reuse the same telemetry item instance (event in this example) to call Track*() multiple times. This practice might cause telemetry to be sent with incorrect configuration.
Custom measurements and properties in Log Analytics
In Log Analytics, custom metrics and properties show in the customMeasurements and customDimensions attributes of each telemetry record.
For example, if you add a property named "game" to your request telemetry, this query counts the occurrences of different values of "game" and shows the average of the custom metric "score":
requests
| summarize sum(itemCount), avg(todouble(customMeasurements.score)) by tostring(customDimensions.game)
Notice that:
- When you extract a value from the
customDimensionsorcustomMeasurementsJSON, it has dynamic type, so you must cast ittostringortodouble. - To take account of the possibility of sampling, use
sum(itemCount)notcount().
Timing events
Sometimes you want to chart how long it takes to perform an action. For example, you might want to know how long users take to consider choices in a game. To obtain this information, use the measurement parameter.
var stopwatch = System.Diagnostics.Stopwatch.StartNew();

// ... perform the timed action ...

stopwatch.Stop();

var metrics = new Dictionary <string, double>
    {{"processingTime", stopwatch.Elapsed.TotalMilliseconds}};

// Set up some properties:
var properties = new Dictionary <string, string>
    {{"signalSource", currentSignalSource.Name}};

// Send the event:
telemetry.TrackEvent("SignalProcessed", properties, metrics);
Default properties for custom telemetry
If you want to set default property values for some of the custom events that you write, set them in a TelemetryClient instance. They're attached to every telemetry item that's sent from that client.
using Microsoft.ApplicationInsights.DataContracts;

var gameTelemetry = new TelemetryClient();
gameTelemetry.Context.GlobalProperties["Game"] = currentGame.Name;
// Now all telemetry is automatically sent with the context property:
gameTelemetry.TrackEvent("WinGame");
Individual telemetry calls can override the default values in their property dictionaries.
To add properties to all telemetry, including the data from standard collection modules, implement ITelemetryInitializer.
Disable telemetry
To dynamically stop and start the collection and transmission of telemetry:
using  Microsoft.ApplicationInsights.Extensibility;

TelemetryConfiguration.Active.DisableTelemetry = true;
Developer mode
During debugging, it's useful to have your telemetry expedited through the pipeline so that you can see results immediately. You also get other messages that help you trace any problems with the telemetry. Switch it off in production because it might slow down your app.
Set the instrumentation key for selected custom telemetry
var telemetry = new TelemetryClient();
telemetry.InstrumentationKey = "---my key---";
// ...
Dynamic connection string
To avoid mixing up telemetry from development, test, and production environments, you can create separate Application Insights resources and change their keys, depending on the environment.
Instead of getting the instrumentation key from the configuration file, you can set it in your code. Set the key in an initialization method, such as global.aspx.cs in an ASP.NET service:
protected void Application_Start()
{
    Microsoft.ApplicationInsights.Extensibility.
    TelemetryConfiguration.Active.InstrumentationKey =
        // - for example -
        WebConfigurationManager.Settings["ikey"];
    ...
}
TelemetryContext
TelemetryClient has a Context property, which contains values that are sent along with all telemetry data. They're normally set by the standard telemetry modules, but you can also set them yourself. For example:
telemetry.Context.Operation.Name = "MyOperationName";
If you set any of these values yourself, consider removing the relevant line from ApplicationInsights.config so that your values and the standard values don't get confused.
- Component: The app and its version.
- Device: Data about the device where the app is running. In web apps, it's the server or client device that the telemetry is sent from.
- InstrumentationKey: The Application Insights resource in Azure where the telemetry appears. It's usually picked up from ApplicationInsights.config.
- Location: The geographic ___location of the device.
- Operation: In web apps, the current HTTP request. In other app types, you can set this value to group events together.
- ID: A generated value that correlates different events so that when you inspect any event in Diagnostic Search, you can find related items.
- Name: An identifier, usually the URL of the HTTP request.
- SyntheticSource: If not null or empty, a string that indicates that the source of the request has been identified as a robot or web test. By default, it's excluded from calculations in Metrics Explorer.
- Session: The user's session. The ID is set to a generated value, which is changed when the user hasn't been active for a while.
- User: User information.
Limits
There are some limits on the number of metrics and events per application, that is, per instrumentation key. Limits depend on the pricing plan that you choose.
| Resource | Default limit | Maximum limit | Notes |
|---|---|---|---|
| Total data per day | 100 GB | Contact support. | You can set a cap to reduce data. If you need more data, you can increase the limit in the portal, up to 1,000 GB. For capacities greater than 1,000 GB, send email to AIDataCap@microsoft.com. |
| Throttling | 32,000 events/second | Contact support. | The limit is measured over a minute. |
| Data retention logs | 30 to 730 days | 730 days | This resource is for Logs. |
| Data retention metrics | 90 days | 90 days | This resource is for Metrics Explorer. |
| Availability multistep test detailed results retention | 90 days | 90 days | This resource provides detailed results of each step. |
| Maximum telemetry item size | 64 KB | 64 KB | |
| Maximum telemetry items per batch | 64,000 | 64,000 | |
| Property and metric name length | 150 | 150 | See type schemas. |
| Property value string length | 8,192 | 8,192 | See type schemas. |
| Trace and exception message length | 32,768 | 32,768 | See type schemas. |
| Availability tests count per Application Insights resource | 100 | 100 | |
| Availability tests count per resource group | 800 | 800 | See Azure Resource Manager |
| Availability tests maximum redirects per test | 10 | 10 | |
| Availability tests minimum test frequency | 300 seconds | Custom test frequencies or frequencies less than 5 minutes require custom TrackAvailability implementations. | |
| .NET Profiler and Snapshot Debugger data retention | Two weeks | Contact support. Maximum retention limit is six months. | |
| .NET Profiler data sent per day | No limit | No limit. | |
| Snapshot Debugger data sent per day | 30 snapshots per day per monitored app | No limit. | The number of snapshots collected per application can be modified through configuration. |
For more information about pricing and quotas, see Application Insights billing.
To avoid hitting the data rate limit, use sampling.
To determine how long data is kept, see Data retention and privacy.
Troubleshooting
For troubleshooting information, including "no data" scenarios and customizing logs, see Troubleshoot Application Insights monitoring of Node.js apps and services.
Next steps
- To review frequently asked questions (FAQ), see:
- Monitor your telemetry in the portal.
- Learn to use Log Analytics and write analytics queries over your telemetry.