Note
Access to this page requires authorization. You can try signing in or changing directories.
Access to this page requires authorization. You can try changing directories.
My previous post on this topic is one of the most viewed (according to our blog analytics in the last week). So I thought it was time to share some extra queries that you many find helpful.
Please see the previous post,
Part 1: https://blogs.msdn.microsoft.com/ukhybridcloud/2017/12/08/azure-log-analytics-disk-space-usage/
The original query I produced was this:
// original capacity query
Perf
| where ObjectName == "LogicalDisk" and CounterName == "% Free Space"
| summarize FreeSpace = min(CounterValue) by Computer, InstanceName
| where strlen(InstanceName) ==2 and InstanceName contains ":"
| where FreeSpace < 50
| sort by FreeSpace asc
| render barchart kind=unstacked
I have now refined it, it’s now a stacked chart (so more than one driver letter is shown per computer) I’ve also added a Let statement to set the % value (my new line #1). This now shows in my example 9 servers that have drives below 60% usage (and one server that has two drives below that value). These servers have a lot of spare space (currently), so you will probably be changing that value to something much smaller?
// New capacity query
let setpctvalue = 60; // enter a % value to check
Perf
| where TimeGenerated > ago(1d)
| where ObjectName == "LogicalDisk" and CounterName == "% Free Space"
| where InstanceName contains ":"
| summarize FreeSpace = min(CounterValue) by Computer, InstanceName
| where FreeSpace < setpctvalue
| render barchart kind = stacked 
If you want you can also restrict this query and add a sort to it by adding these lines just before the final one. I just wanted the Top 5 disks listed – this is useful if you have many servers and drives below your required threshold.
| top 5 by min_CounterValue
| sort by min_CounterValue desc nulls last 
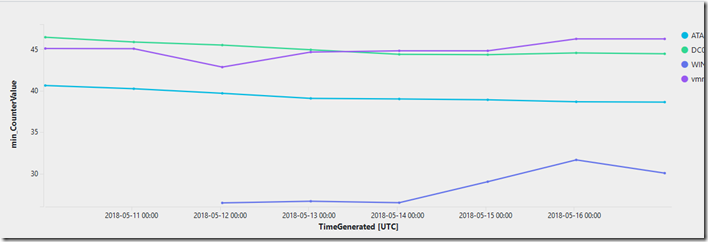
To add to this capability I wanted to track down some C: drive issues, and also wanted to look over more than a 1 day period. In this example I selected 7 days, once again to aid readability I added a Let statement for this.
I also added bin (TimeGenerated) to see the extra days of data, and this also allows a TimeChart to be used. An extra modification was changing line #7 to look at only C: - other drive letters are available.
// Chart C: if its under nn% over the past nn days
let setpctValue = 50; // enter a % value to check
let startDate = ago(7d); // enter how many days to look back on
Perf
| where TimeGenerated > startDate
| where ObjectName == "LogicalDisk" and CounterName == "% Free Space"
| where InstanceName contains "C:"
| summarize min(CounterValue) by Computer, InstanceName, bin (TimeGenerated, 1d)
| where min_CounterValue < setpctValue
| sort by min_CounterValue desc nulls last
| render timechart
This showed 4 servers and the data for the past 7days – and I now have this published to my Azure Dashboard.
That’s all for today, there will be a Part 3 where I’ll look at a Trend line and a capacity estimate to see when the drive space will be zero.
Comments
- Anonymous
September 06, 2018
Part 3! https://blogs.msdn.microsoft.com/ukhybridcloud/2018/05/18/azure-log-analytics-disk-space-usage-part-3/- Anonymous
September 07, 2018
Thanks Mike, post is now updated
- Anonymous
