Note
Access to this page requires authorization. You can try signing in or changing directories.
Access to this page requires authorization. You can try changing directories.
In this article, you learn how to monitor the Azure Kubernetes Service (AKS) control plane by using control plane metrics in Azure Monitor.
AKS supports a subset of control plane metrics free through Azure Monitor platform metrics. The control plane metrics feature gives you visibility into the availability and performance of critical control plane components like the API server, etcd, the scheduler, the autoscaler, and the controller manager in AKS. The feature is also fully compatible with the managed service for Prometheus and Azure Managed Grafana. You can use these metrics to maximize overall observability and to maintain operational excellence for your AKS cluster.
Control plane platform metrics
AKS offers some free control plane metrics for monitoring the API server and etcd. These metrics are automatically collected for all AKS clusters at no cost. You can analyze the metrics by using the metrics explorer in the Azure portal. You can also create metrics-based alerts by using the metrics data.
To see the full list of supported control plane platform metrics, see the AKS monitoring reference.
Prerequisites and limitations
- The control plane metrics (preview) feature supports only the managed service for Prometheus in Azure Monitor.
- Azure Private Link isn't supported.
- You can customize only the default
ama-metrics-settings-configmap.yamlconfigmap file. No other customization is supported. - Your AKS cluster must use managed identity authentication.
Install the aks-preview extension
Important
AKS preview features are available on a self-service, opt-in basis. Previews are provided "as is" and "as available," and they're excluded from the service-level agreements and limited warranty. AKS previews are partially covered by customer support on a best-effort basis. As such, these features aren't meant for production use. For more information, see the following support articles:
Install or update the
aks-previewAzure CLI extension by using theaz extension addoraz extension updatecommand:# Install the aks-preview extension az extension add --name aks-preview # Update the aks-preview extension az extension update --name aks-preview
Register the AzureMonitorMetricsControlPlanePreview feature flag
Register the
AzureMonitorMetricsControlPlanePreviewfeature flag by using theaz feature registercommand:az feature register --namespace "Microsoft.ContainerService" --name "AzureMonitorMetricsControlPlanePreview"It takes a few minutes for the status to show as Registered.
Verify the registration status by using the
az feature showcommand:az feature show --namespace "Microsoft.ContainerService" --name "AzureMonitorMetricsControlPlanePreview"When the status is Registered, refresh the registration of the Microsoft.ContainerService resource provider by using the
az provider registercommand:az provider register --namespace "Microsoft.ContainerService"
Enable control plane metrics on an AKS cluster
Enable control plane metrics by using the managed service for Prometheus add-on when you create a new cluster or update an existing cluster.
Note
Unlike the metrics that are collected from cluster nodes, control plane metrics are collected by a component that isn't part of the ama-metrics add-on. Enabling the AzureMonitorMetricsControlPlanePreview feature flag and the managed service for Prometheus add-on ensures that control plane metrics are collected. After you enable metrics collection, it can take several minutes for the data to appear in the workspace.
New AKS cluster
To learn how to collect managed service for Prometheus metrics from your AKS cluster, see Enable Prometheus and Grafana for AKS clusters. For an AKS cluster, complete the steps described on the CLI tab.
Existing AKS cluster
If your cluster already has the managed service for Prometheus add-on, update the cluster to ensure that it collects control plane metrics by using the az aks update command:
az aks update --name $CLUSTER_NAME --resource-group $RESOURCE_GROUP
Query control plane metrics
Control plane metrics are stored in an Azure Monitor workspace in the cluster's region. You can query the metrics directly in the workspace or by using the Azure Managed Grafana instance that's connected to the workspace.
In the Azure portal, go to your AKS cluster resource.
On the left menu, select Monitor > Monitor Settings.
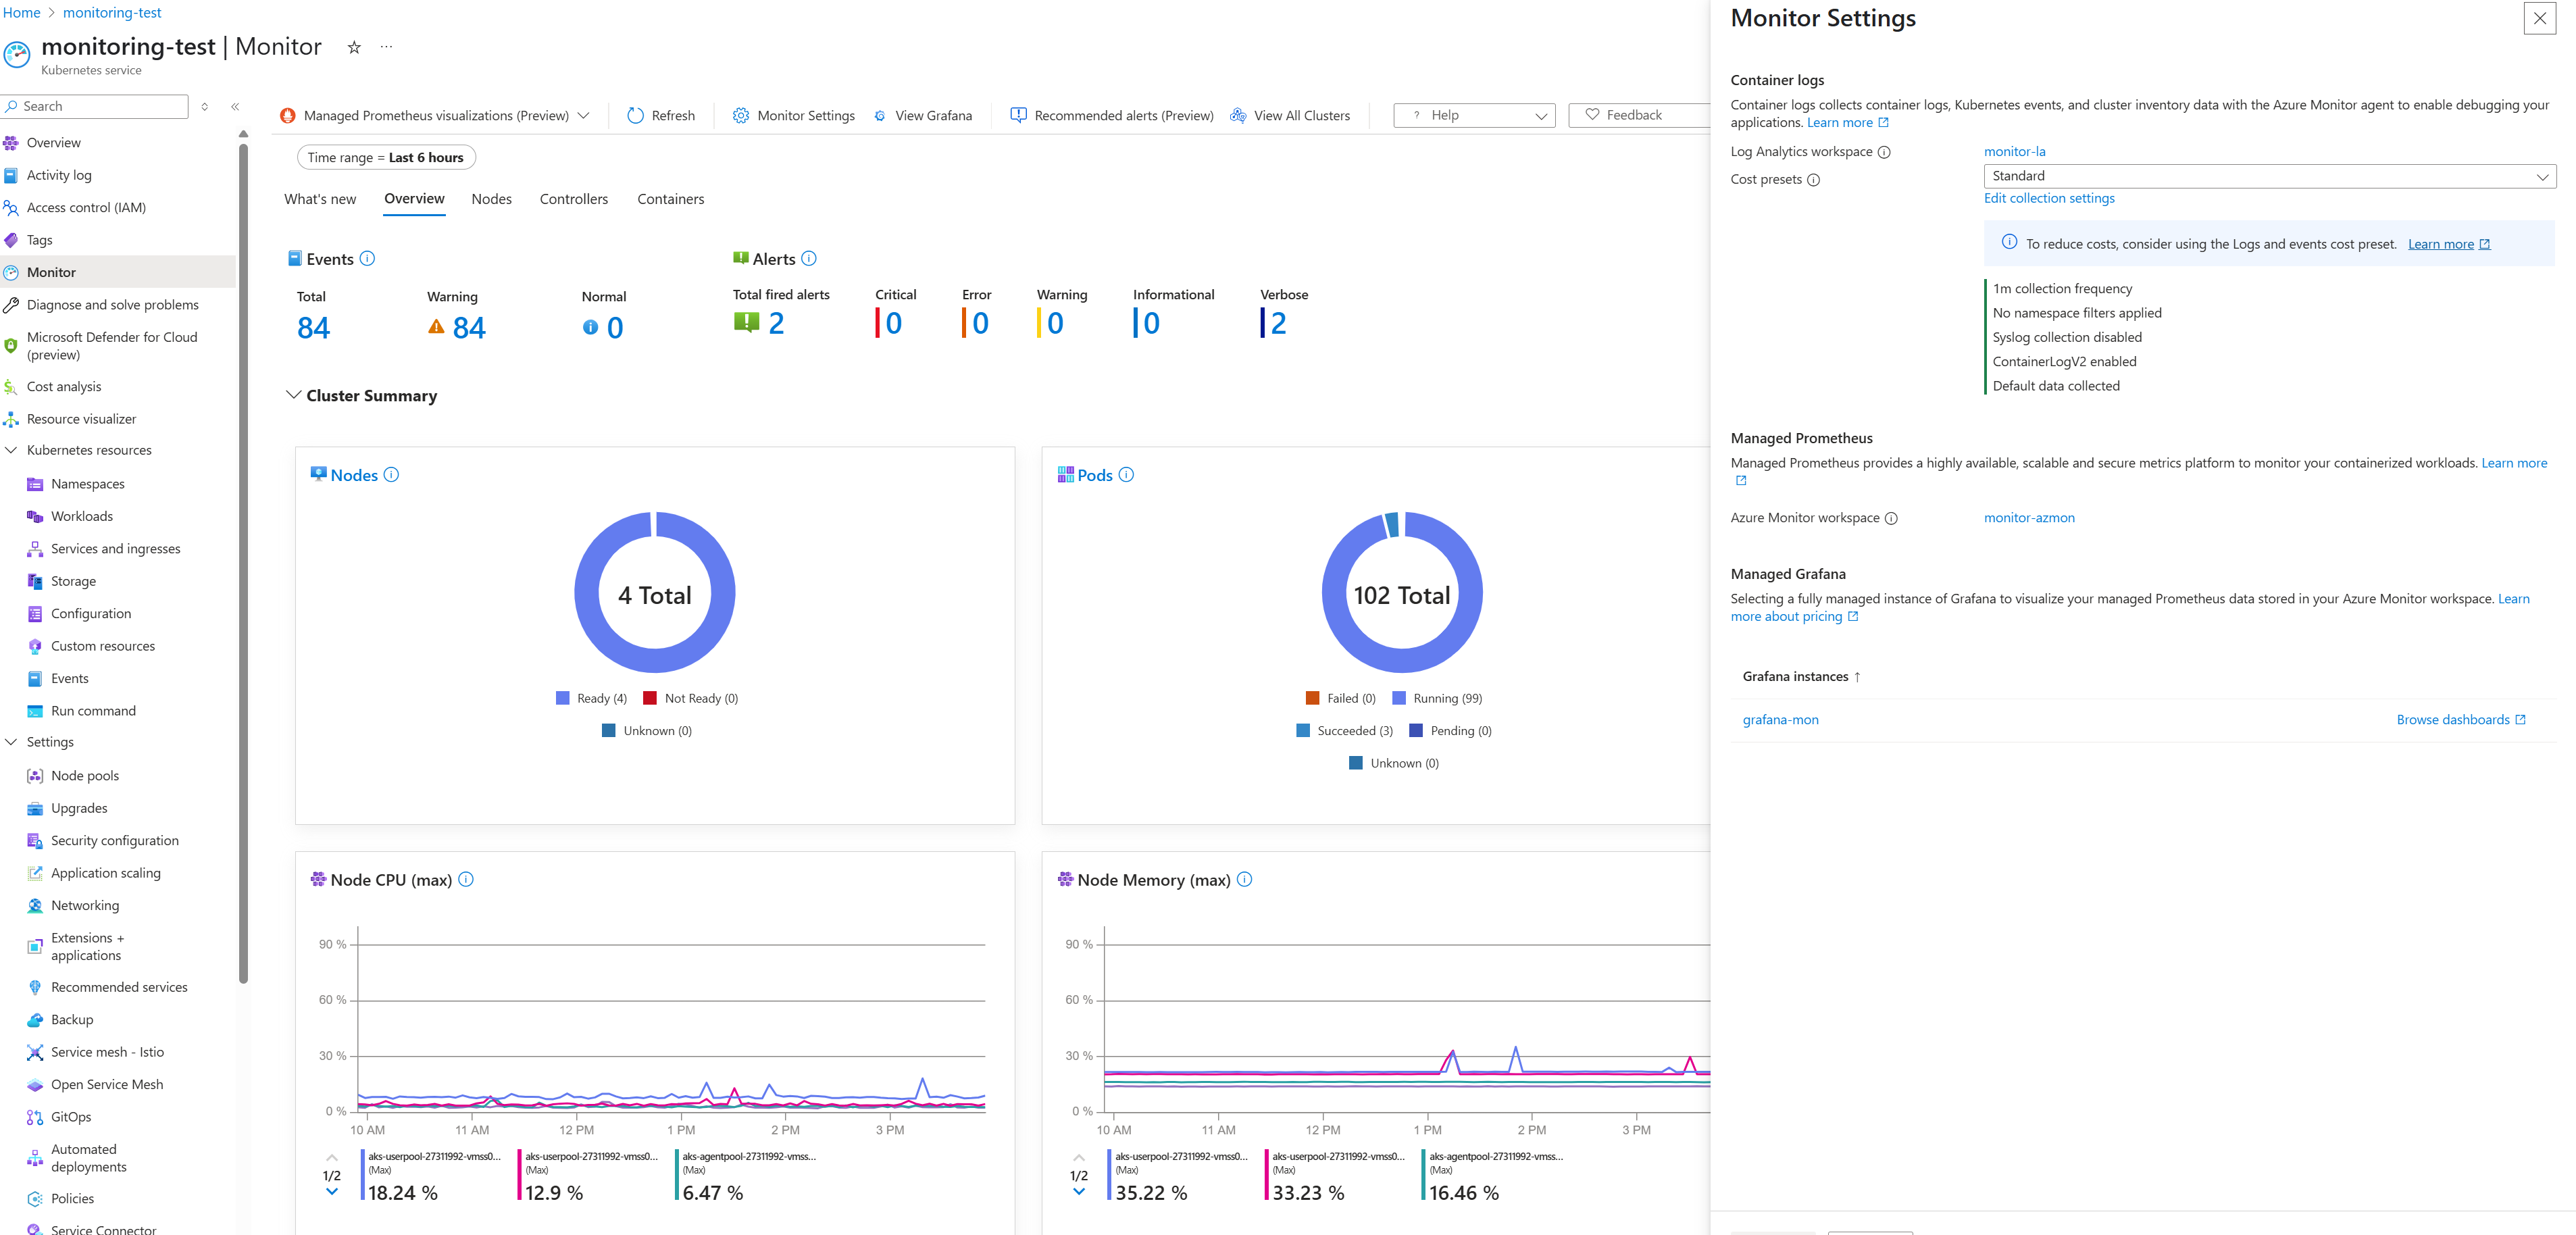
Go to the Azure Monitor workspace that is linked to the cluster.
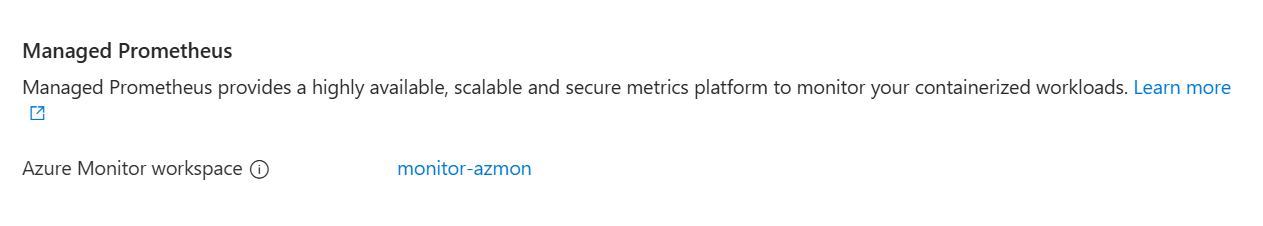
In the Azure Monitor workspace, under Managed Prometheus, query the metrics by using the Prometheus explorer.


Note
AKS provides dashboard templates to help you view and analyze your control plane telemetry data in real time. If you use Azure Managed Grafana to visualize the data, you can import the following dashboards:
Customize control plane metrics
AKS includes a preconfigured set of metrics to collect and store for each component. Metrics for the API server and etcd are collected by default. You can customize the list of metrics that are collected by modifying the ama-metrics-settings-configmap.yaml configmap file.
Default targets include the following values:
controlplane-apiserver = true
controlplane-cluster-autoscaler = false
controlplane-kube-scheduler = false
controlplane-kube-controller-manager = false
controlplane-etcd = true
All configmap files should be applied to the kube-system namespace for any cluster.
Customize an ingestion profile
You can customize an ingestion file for collected metrics. For more information, see Minimal ingestion profile for control plane metrics in managed service for Prometheus.
Ingest only minimal metrics from default targets
- Set
default-targets-metrics-keep-list.minimalIngestionProfiletotrue, so it ingests only the minimal set of metrics for each of the default targets:controlplane-apiserverandcontrolplane-etcd.
Ingest all metrics from all targets
Download the
ama-metrics-settings-configmap.yamlconfigmap file.Rename the configmap file
configmap-controlplane.yaml.Set
minimalingestionprofiletofalse.Under
default-scrape-settings-enabled, verify that the targets you want to scrape are set totrue.The targets you can set are:
controlplane-apiservercontrolplane-cluster-autoscalercontrolplane-kube-schedulercontrolplane-kube-controller-managercontrolplane-etcd
Apply the configmap file by using the
kubectl applycommand:kubectl apply -f configmap-controlplane.yaml
After you apply the configuration, it takes several minutes for the metrics from the specified targets that are scraped from the control plane to appear in the Azure Monitor workspace.
Ingest more than minimal metrics
Using the minimalingestionprofile setting helps reduce the ingestion volume of metrics. If set to true, only default recording rules, default alerts, and metrics that appear in the default dashboards are collected.
Download the
ama-metrics-settings-configmap.yamlconfigmap file.Rename the configmap file
configmap-controlplane.yaml.Set
minimalingestionprofiletotrue.Under
default-scrape-settings-enabled, verify that the targets you want to scrape are set totrue.The targets you can set are:
controlplane-apiservercontrolplane-cluster-autoscalercontrolplane-kube-schedulercontrolplane-kube-controller-managercontrolplane-etcd
Under
default-targets-metrics-keep-list, specify the list of metrics for thetruetargets.For example:
controlplane-apiserver= "apiserver_admission_webhook_admission_duration_seconds|apiserver_longrunning_requests"Apply the configmap file by using the
kubectl applycommand:kubectl apply -f configmap-controlplane.yaml
After you apply the configuration, it takes several minutes for the metrics from the specified targets that are scraped from the control plane to appear in the Azure Monitor workspace.
Ingest specific metrics from specific targets
Download the
ama-metrics-settings-configmap.yamlconfigmap file.Rename the configmap file
configmap-controlplane.yaml.Set
minimalingestionprofiletofalse.Under
default-scrape-settings-enabled, verify that the targets that you want to scrape are set totrue.The targets you can set are:
controlplane-apiservercontrolplane-cluster-autoscalercontrolplane-kube-schedulercontrolplane-kube-controller-managercontrolplane-etcd
Under
default-targets-metrics-keep-list, specify the list of metrics for thetruetargets.For example:
controlplane-apiserver= "apiserver_admission_webhook_admission_duration_seconds|apiserver_longrunning_requests"Apply the configmap file:
kubectl apply -f configmap-controlplane.yaml
After you apply the configuration, it takes several minutes for the metrics from the specified targets that are scraped from the control plane to appear in the Azure Monitor workspace.
Troubleshoot control plane metrics issues
Make sure that the AzureMonitorMetricsControlPlanePreview feature flag is enabled and that the ama-metrics pods are running.
Note
The troubleshooting methods for the managed service for Prometheus don't apply directly in this scenario. The components that scrape the control plane aren't included in the managed service for Prometheus add-on.
Configmap file formatting: Make sure that you use the correct formatting in the configmap file. Verify that the fields
default-targets-metrics-keep-list,minimal-ingestion-profile, anddefault-scrape-settings-enabledand other fields are correctly populated with their intended values.Isolate the control plane from the data plane: Start by setting some of the node-related metrics to
true, and then verify that the metrics are forwarded to the workspace. Completing these steps helps you determine whether an issue is specific to scraping control plane metrics.A change in the number of events ingested: After you apply the changes, you can open the metrics explorer in the Azure portal. Go to the Azure Monitor overview pane for the cluster or go to the Monitoring section of the selected cluster. Check for an increase or a decrease in the number of events ingested per minute. This information can help you determine whether a specific metric is missing or if all metrics are missing.
A specific metric isn't exposed: In some scenarios, a metric is documented, but it isn't exposed from the target and isn't forwarded to the Azure Monitor workspace. In this case, it's necessary to verify that other metrics are forwarded to the workspace.
Note
If you want to collect the
apiserver_request_duration_secondsmetric or another bucket metric, you must set the entire series in the histogram family:controlplane-apiserver = "apiserver_request_duration_seconds_bucket|apiserver_request_duration_seconds_sum|apiserver_request_duration_seconds_count"No access to the Azure Monitor workspace: When you enable the add-on, you might specify an existing workspace that you can't access. In that scenario, it appears that metrics aren't collected and forwarded. Make sure that you create a new workspace to use to collect metrics when you enable the add-on or when you create the cluster.
Disable control plane metrics on your AKS cluster
You can disable control plane metrics at any time by disabling the managed service for Prometheus add-on and unregistering the AzureMonitorMetricsControlPlanePreview feature flag.
Remove the metrics add-on that scrapes Prometheus metrics by using the
az aks updatecommand:az aks update --disable-azure-monitor-metrics --name $CLUSTER_NAME --resource-group $RESOURCE_GROUPTo disable scraping control plane metrics on the AKS cluster, unregister the
AzureMonitorMetricsControlPlanePreviewfeature flag via theaz feature unregistercommand:az feature unregister "Microsoft.ContainerService" --name "AzureMonitorMetricsControlPlanePreview"
Frequently asked questions
Can I scrape control plane metrics by using self-hosted Prometheus?
No. Currently, you can't scrape control plane metrics by using self-hosted Prometheus. Self-hosted Prometheus can scrape only a single instance, depending on the load balancer, so the metrics aren't reliable. Often, multiple replicas of the control plane metrics are visible only through the managed service for Prometheus.
Why isn't the user agent available in the control plane metrics?
In AKS, control plane metrics don't have the user agent. The user agent is available only through the control plane logs that you access in diagnostic settings.
Related content
Collaborate with us on GitHub
The source for this content can be found on GitHub, where you can also create and review issues and pull requests. For more information, see our contributor guide.

Azure Kubernetes Service