Note
Access to this page requires authorization. You can try signing in or changing directories.
Access to this page requires authorization. You can try changing directories.
This article explains how to use Grafana with Azure Monitor. It covers free Azure dashboards for integrated data and Managed Grafana for advanced features.
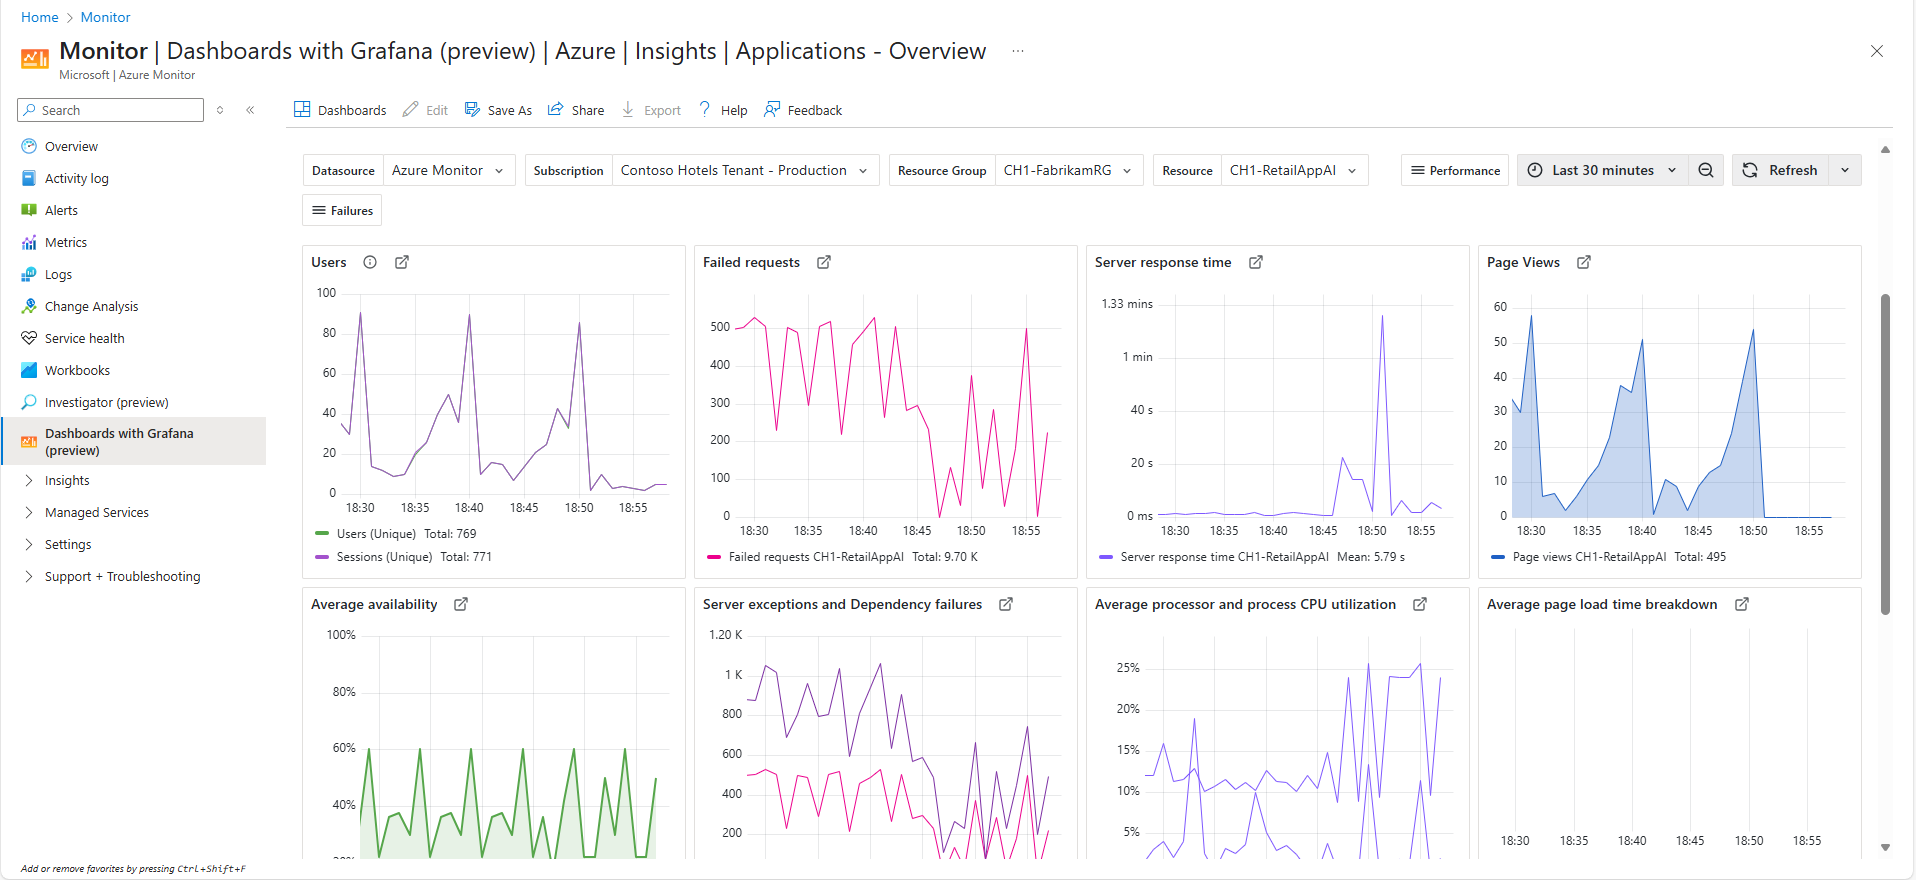
Dashboards with Grafana (Preview)
Azure Monitor dashboards with Grafana enable you to use Grafana's query, transformation, and visualization capability on:
You can:
- Create and edit dashboards directly in the Azure portal for free and without administrative overhead.
- Import dashboards from thousands of publicly available Grafana community dashboards.
- Apply a wide range of Grafana visualizations and client-side transformations to Azure monitoring data.
- Manage Grafana dashboards as native Azure resources, including using Azure RBAC and automation via ARM template and Bicep templates.
You can access Azure Monitor dashboards with Grafana through the Azure portal from Azure Monitor or Azure Kubernetes Services.
You can create and edit dashboards and create your own copy to modify them without editing the original. You can also tag the dashboards.


Limitations
- Preview limitations. Support for Grafana Explore, Dashboard links and Exemplars isn't yet available. Dashboards are available in a limited number of Azure regions during Preview.
- Unsupported features. Grafana evaluated alerts, reports, library panels, snapshots, playlists, app plugins, and copying panels across different dashboards.
Managed Grafana
You can monitor Azure services and applications by using Grafana and the included Azure Monitor data source plug-in. The plug-in retrieves data from these Azure services:
- Azure Monitor Metrics for numeric time series data from Azure resources.
- Azure Monitor Logs for log and performance data from Azure resources that enables you to query by using the powerful Kusto Query Language (KQL). You can use Application Insights log queries to retrieve Application Insights log-based metrics.
- Application Insights log-based metrics to let you analyze the health of your monitored apps. You can use Application Insights log queries in Grafana to use the Application Insights log metrics data.
- Azure Monitor Traces to query and visualize distributed tracing data from Application Insights.
- Azure Resource Graph to quickly query and identify Azure resources across subscriptions.
You can also use the Grafana Prometheus plugin to query and visualize data from Azure Monitor managed service for Prometheus. For more information, see Connect Grafana to Azure Monitor Prometheus metrics.
You can then display this performance and availability data on your Grafana dashboard.
Managed Grafana related content
The following is a list of related managed Grafana documentation. For general information about Azure Managed Grafana, see Azure Managed Grafana overview
Containers
- Monitor Kubernetes
- Enable monitoring for Kubernetes clusters, Enable Prometheus, and Grafana
- Default Grafana dashboard configuration for Prometheus
- Container insights log schema, Install Grafana dashboard
- Importing specific Grafana dashboards
Metrics
- Link to a Grafana dashboard in a an Azure Monitor workspace
- Connect Grafana to Azure Monitor Prometheus metrics
System Center Operations Manager(SCOM)
- Dashboards on Azure Managed Grafana
- Query Azure Monitor SCOM Managed Instance data from Azure Managed Grafana dashboards
When to use
Choose Azure Monitor dashboards with Grafana if you store observability and telemetry data exclusively in Azure.
Choose managed Grafana if you need access to external data sources and automation, including open-source and Grafana enterprise data sources, Grafana alerts, scheduled reports, and the ability to share access to dashboards without sharing access to the underlying data store.
Solution comparison
| Feature | Azure Monitor dashboards with Grafana (preview) | Azure Managed Grafana |
|---|---|---|
| Access | Azure portal | Grafana Web Interface |
| Pricing | No cost | Per user pricing plus compute costs for Standard SKU |
| Data Sources | Azure Monitor and Azure Prometheus | Azure Monitor, Azure Prometheus, Azure Data Explorer, OSS data sources, Enterprise data sources available with license |
| Data source authentication | Current-user only | User-configurable: Current-user, Managed Identity, App registration |
| Data source administration | N/A – depends on user RBAC roles | User-managed data sources |
| Compute resources | SaaS | Dedicated virtual machine scale sets |
| Grafana Enterprise | Not supported | Available with license |
| Additional Plugins | Azure-managed only | Azure-managed, open-source, and optional third-party with Enterprise |
| Grafana Alerts | Not supported | Supported |
| Grafana Email Notification | Not supported | Supported |
| Reporting | Not supported | Supported |
| Private networking | Not supported | Private link and managed private endpoint |
| Deterministic outbound IP | Not supported | Supported |
| Zone redundancy | Enabled by default | Supported |