Note
Access to this page requires authorization. You can try signing in or changing directories.
Access to this page requires authorization. You can try changing directories.
Azure DevOps Services | Azure DevOps Server | Azure DevOps Server 2022 | Azure DevOps Server 2020
In Azure DevOps dashboards, burndown and burnup widgets give you flexibility to create charts for any type of scope or number of teams in specified time periods. Burndown charts focus on remaining work. Burnup charts focus on completed work. Both chart types help your team determine whether you're on track to complete your work by the end date. For an overview of all burndown and burnup charts available to you, see Burndown and burnup guidance.
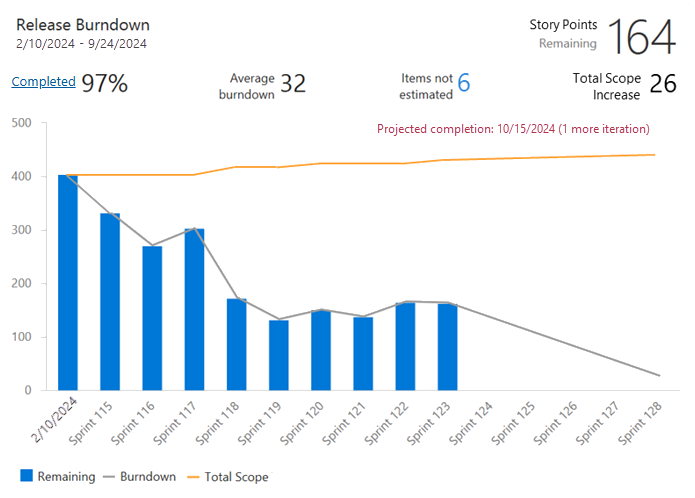
The following screenshot shows a burndown widget configured to display a release burndown.
Prerequisites
| Category | Requirements |
|---|---|
| Access levels | - Project member. - At least Basic access. |
| Permissions | - Team administrator or project administrator or specific dashboard permissions granted to you. - To add a widget to a team dashboard: Member of the team. |
| Feature enablement | Azure Boards enabled. If disabled, none of the work-tracking Analytics widgets are displayed. To re-enable it, see Turn a service on or off. |
| Task awareness | Awareness of any required or recommended tasks listed later in this article. |
| Category | Requirements |
|---|---|
| Access levels | - Project member. - At least Basic access. |
| Permissions | - Team administrator or project administrator or specific dashboard permissions granted to you. - To add a widget to a team dashboard: Member of the team. |
| Feature enablement | - Azure Boards enabled. If disabled, none of the work-tracking Analytics widgets are displayed. To re-enable it, see Turn a service on or off. - Analytics installed and enabled. Members of the Project Collection Administrators group can add extensions or enable the service. Organization owners are automatically members of this group. |
Add the widget to your dashboard
Use the following procedure to add a burndown or burnup widget to your dashboard.
Go to
https://dev.azure.com/{your-organization}to sign in to your organization.Go to your project. Select Dashboards, and then select
 Edit.
Edit.
Select a widget, and then select Add.


Configure burndown or burnup widget
To configure either widget type, take the following steps. The only difference between the burndown and burnup widgets is that the burnup widget plots work completed and the burndown widget plots work remaining. For more information, see Interpret a burndown or burnup chart, later in this article.
On the widget, select
 Configure.
Enter the configuration information, described in the following table, and then select Save.
| Configuration category | Guidance |
|---|---|
| Teams | To track progress across teams, add more teams. You can select teams from other projects, but the lists of selectable backlogs, work item types, and fields are based on your current project. You can track progress across multiple projects only if the process for those projects is the same, or at least similar. |
| Work items | Select the type of backlog or work item for burn down. The Backlog category includes all the work item types configured for that backlog. If you use a hosted XML process to customize your project and you have a customized category name for bug work items, the burndown and burnup charts can't query for work items in that category. If you want to query for bugs, your customized bug work item type must belong to the default category for bugs, Bug category. That category has a reference name of Microsoft.BugCategory. |
| Field criteria | Select field criteria to limit the work items that appear in the chart. Filtering is based on the values assigned to the fields of each work item. But filtering uses the values assigned at the time of each revision within the tracking period. Values aren't assigned retroactively from the start of a work item's history. For more information, see Filters that apply to historical data. Analytics-based charts are built based on the WorkItemsSnapshot entity set. Snapshot entity types are modeled as daily snapshots. Data aggregation starts on the date an assignment is made, because the widget doesn't recognize assignments until you apply them. So if you want to filter a burndown or burnup widget based on field or tag assignments, assign the fields or tags before the start of the period that you want to monitor.When you configure field criteria, you can filter on a null value. The result is consistent with the result of a query that uses the same field criteria. |
| Burndown on | Select the way you want to calculate burndown. Options include Count to use a count of work items, and Sum to take the sum of a selected field. You can select from standard or custom fields that have an integer or decimal data type, such as Story Points, Effort, or Remaining Work. Burndown works best when you aggregate size fields like Story Points. If you choose to burn down on fields that change during the sprint, like Remaining Work for Tasks, the Items not Estimated value grows as items get closed. |
| Time period | Configure the time period for the chart. - Start date: Determines the original scope baseline. The chart burns down from the original scope. - End date: Specifies the target date of completion. Your goal is to burn down the original scope of work by the end date. |
| Plot interval | Select the intervals to plot in the date range of your chart. To plot the burndown by iteration instead of by date, select a start date, and then set the Plot burndown by value to Iteration. The average burndown is based on the selected interval. The calculations for the average burndown assume that every interval is the same length. For example, the interval between the start date and the end of the first month is assumed to be a full month, even if that first month is a partial month. For best results, enter a Start date value that's the same as the first month's start date. The same logic applies when you plot by weekly intervals. |
| Advanced features | Select advanced features to include in your chart: - Show total scope: Shows historical and projected scope increase. - Show Resolved work items as Completed: When checked, the widget treats work items in a Resolved state—or any state your process maps to the Completed state category—as completed for chart metrics (completed totals, projected completion, and completed-work plots). This setting changes only the widget's interpretation for the chart and does not modify your process configuration.- Burndown chart options: - Show burndown: Shows historical and projected burndown (plots remaining work). - Show completed work: Shows completed work as stacked bars by work item type. - Plot remaining work using work item type color: Colors remaining work by work item type; the widget stacks colors when multiple work items appear. - Burnup chart options: - Show burnup: Shows historical and projected burnup (plots completed work). - Show remaining work: Shows remaining work as stacked bars by work item type. - Plot completed work using work item type color: Colors completed work by work item type; the widget stacks colors when multiple work items appear. |
| Configuration category | Guidance |
|---|---|
| Teams | To track progress across teams, add more teams. You can select teams from other projects, but the lists of selectable backlogs, work item types, and fields are based on your current project. You can track progress across multiple projects only if the process for those projects is the same. |
| Work items | Select the type of backlog or work item for burn down. The Backlog category includes all the work item types configured for that backlog. If you select the Stories backlog, you have another option: Include bugs on the Stories backlog. Select this option if you want to include bugs along with user stories in your burndown. For Scrum projects, this option is available for the product backlog item (PBI) backlog. For Capability Maturity Model Integration (CMMI) projects, this option is available for the requirements backlog. If you use a hosted XML process to customize your project and you have a customized category name for bug work items, the burndown and burnup widgets can't query for work items in that category. If you want to query for bugs, your customized bug work item type must belong to the default category for bugs, Bug category. That category has a reference name of Microsoft.BugCategory. |
| Field criteria | Select field criteria to limit the work items that appear in the chart. Filtering is based on the values assigned to the fields of each work item. But filtering uses the values assigned at the time of each revision within the tracking period. Values aren't assigned retroactively from the start of a work item's history. For more information, see Filters that apply to historical data. Analytics-based charts are built based on the WorkItemsSnapshot entity set. Snapshot entity types are modeled as daily snapshots. Data aggregation starts on the date an assignment is made, because the widget doesn't recognize assignments until you apply them. So if you want to filter a burndown or burnup widget based on field or tag assignments, assign the fields or tags before the start of the period that you want to monitor.When you configure field criteria, you can filter on a null value. The result is consistent with the result of a query that uses the same field criteria. |
| Burndown on | Select the way you want to calculate burndown. Options include Count to use a count of work items, and Sum to take the sum of a selected field. You can select from standard or custom fields that have an integer or decimal data type, such as Story Points, Effort, or Remaining Work. Burndown works best when you aggregate size fields like Story Points. If you choose to burn down on fields that change during the sprint, like Remaining Work for Tasks, the Items not Estimated value grows as items get closed. |
| Time period | Configure the time period for the chart. - Start date: Determines the original scope baseline. The chart burns down from the original scope. - End date: Specifies the target date of completion. Your goal is to burn down the original scope of work by the end date. |
| Plot interval | Select the intervals to plot in the date range of your chart. The average burndown is based on the selected interval. Intervals can be time periods, such as a day, a week, or a month, or intervals can be based on an iteration schedule. The calculations for the average burndown assume that every interval is the same length. For example, the interval between the start date and the end of the first month is assumed to be a full month, even if that first month is a partial month. For best results, enter a Start date value that's the same as the first month's start date. The same logic applies when you plot by weekly intervals. |
| Advanced features | Select advanced features to include in your chart: - Show total scope: Shows historical and projected scope increase. - Show Resolved work items as Completed: When checked, the widget treats work items in a Resolved state—or any state your process maps to the Completed state category—as completed for chart metrics (completed totals, projected completion, and completed-work plots). This setting changes only the widget's interpretation for the chart and does not modify your process configuration.- Burndown chart options: - Show burndown: Shows historical and projected burndown (plots remaining work). - Show completed work: Shows completed work as stacked bars by work item type. - Plot remaining work using work item type color: Colors remaining work by work item type; the widget stacks colors when multiple work items appear. - Burnup chart options: - Show burnup: Shows historical and projected burnup (plots completed work). - Show remaining work: Shows remaining work as stacked bars by work item type. - Plot completed work using work item type color: Colors completed work by work item type; the widget stacks colors when multiple work items appear. |
Interpret a burndown or burnup chart
Your team can use a burndown or burnup chart to get immediate insight about their progress and to learn about their rhythm and behavior. Most burndown lines aren't straight lines, because teams generally don't move at a fixed velocity. Scope increases can occur over time and affect velocity. For example, if your projected completion date moves, you might ask one of the following questions:
- Are we adding too much scope?
- Is the average burn rate changing, and if so, why?
Burndown charts also help teams understand risks to their release. If the projected end date exceeds the release target date, teams might need to reduce scope or lengthen the project. Burndown can also indicate that progress is greater than expected, providing the uncommon, but advantageous option of adding scope.
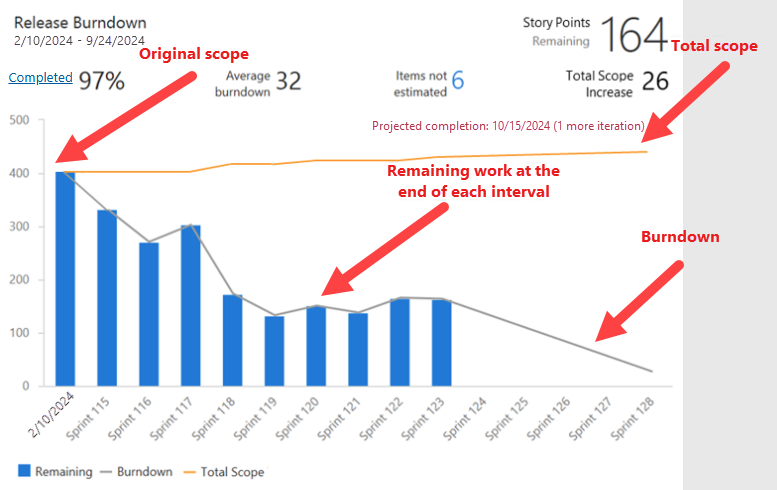
As the following diagram shows, charts based on the burndown or burnup widgets provide many calculated elements.
| Element | Description |
|---|---|
| Date range | The start and end date of the burndown. When burndown gets plotted by iterations, the end date is the end of the last iteration. |
| Main metric | The current remaining work based on the selected burndown method. |
| Percentage completed | The percentage of work completed based on the original scope. To see the full list of completed work items, select Completed. |
| Average burndown | The average work completed per interval or iteration. |
| Items not estimated | A metric that displays only when you burn down on the sum of a field. It represents the current number of items that don't have a value in the selected Burndown on field. To see a full list of work items without estimates, select the Items not estimated value. |
| Total Scope Increase | The amount of work added to the original scope since the start of the burndown. |
| Projected completion | The projected completion date based on the remaining work, historical burndown, and scope increase rates. If the projected completion date is before the specified end date, it appears as a vertical line on the interval when the work should be complete. If the projected completion date is after the specified end date, it appears as text that indicates the number of other intervals or iterations needed to complete the work. |
| Original scope | All the remaining work since the specified start date. The chart burns down from the original scope. The completed percentage and the Total Scope Increase value are calculated based on your original scope. |
| Total scope | The total scope of the burndown. The plotted points include both completed and remaining work. The total scope line indicates the scope change of your project. For past data points, the plotted total scope represents actual total scope as of the end of each interval or iteration. For future data points, the plotted total scope represents a projected scope change, based on past scope changes. |
| Burndown | The burndown value, which tells you how quickly you're burning down the work. For past data points, the plotted burndown represents actual burndown as of the end of each interval or iteration. For future data points, the plotted burndown represents a projected burndown, based on past burndown. |
Important
- Deleting Area Path values or reconfiguring Iteration Path values causes irreversible data loss in the following charts:
- Burndown and burnup widget charts
- Sprint burndown charts
- Velocity charts for teams with changed area paths
- Historical trend charts that reference the Area Path and Iteration Path values as defined at the time for each work item
- When you delete these paths, you can't retrieve their historical data.
- You can delete area and iteration paths only when they're no longer used by any work items.