Note
Access to this page requires authorization. You can try signing in or changing directories.
Access to this page requires authorization. You can try changing directories.
Azure DevOps Services | Azure DevOps Server 2022 | Azure DevOps Server 2020
You can use cumulative flow diagrams (CFDs) to monitor the flow of work through a system. The cycle time and lead time are the two primary metrics that are used for tracking. You can extract these metrics from a CFD.
This article shows you how you can use CFDs, cycle times, and lead times to identify issues in your work process and help you move work through your system.
- To configure or view a CFD, see View and configure a cumulative flow diagram.
- To add a lead time or cycle time control chart to a dashboard, see Lead Time and Cycle Time widgets.
Sample charts and primary metrics
The continuous-flow CFD provides the chart that's most favored by teams that follow a lean process.
However, many teams combine lean practices with Scrum or other methodologies. As a result, they use lean practices within the span of an iteration or sprint. In this situation, the diagram takes on a slightly different look. It provides two extra, and very valuable, pieces of information, as shown in the next chart, the fixed-period CFD.
Continuous-flow CFD

This fixed-period CFD is for a completed sprint.
The top line represents the scope set for the sprint. Because the work must be completed by the last day of the sprint, the slope of the Closed state indicates whether a team is on track to complete the sprint. The easiest way to think of this view is as a burnup chart.
In the chart, the first step in the process is depicted as the upper-left area. The last step in the process is depicted as the bottom-right area.
Fixed-period CFD for a completed sprint

Chart metrics
CFDs display the count of work items grouped by state, or column, over time. The two primary metrics that are used for tracking are the cycle time and lead time. You can extract these metrics from the chart.
Metric
Definition
Cycle time 1
The time it takes to move work through a single process or workflow state. The length is measured from the start of one process to the start of the next process.
Lead time 1
For a continuous-flow process: The time from when a request is made (such as adding a proposed user story) until that request is completed (closed).
For a sprint or fixed-period process: The time from when work on a request begins until the work is completed (for example, the time from the Active to the Closed state).
Work in progress (WIP)
The amount of work or number of work items that are actively being worked on.
Scope
The amount of work committed for the given period of time. This metric only applies to fixed-period processes.
1 The CFD widget that uses Analytics data and the built-in CFD that you can view from a team backlog or board don't provide discrete lead time and cycle time values. However, the Lead Time and Cycle Time widgets do provide these values.
There's a well-defined correlation between lead time or cycle time and WIP. More WIP results in longer cycle times, which lead to longer lead times. The opposite is also true—less WIP results in shorter cycle and lead times. When the development team focuses on fewer items, they reduce the cycle and lead times. This correlation is a key reason why you should set WIP limits on the board you use to track and manage work.
The count of work items indicates the total amount of work on a given day. In a fixed-period CFD, a change in this count indicates scope change for a given period. In a continuous-flow CFD, it indicates the total amount of work that's in the queue and completed for a given day.
Categorizing work into specific board columns shows you the amount of work in each area of the process. This view provides insights on where work is moving smoothly, where there are blockages, and where no work is being done at all. It's difficult to decipher a tabular view of the data. However, the visual CFD helps you understand what's happening in your work process and why it's happening.
Identify issues and take appropriate actions
The CFD provides answers to the following questions. Based on the answers, you can adjust the process to move work through the system.
Will the team complete work on time?
This question applies to fixed-period CFDs only. You can gain an understanding by looking at the curve (or progression) of work in the last column of the board.

In this scenario, you might consider reducing the scope of work in the iteration. This action is appropriate if it's clear that the work isn't being completed quickly enough, assuming it continues at a steady pace. This scenario can indicate that the work was underestimated and should be factored into the next sprint's planning.
However, there might be other reasons the work isn't being completed quickly enough. You can determine those reasons by looking at other data on the chart.
How is the flow of work progressing?
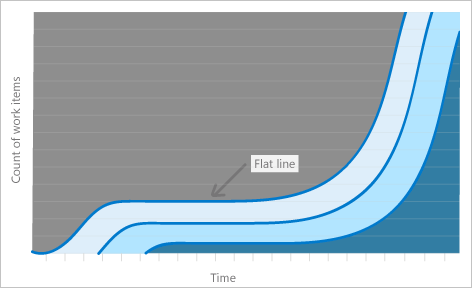
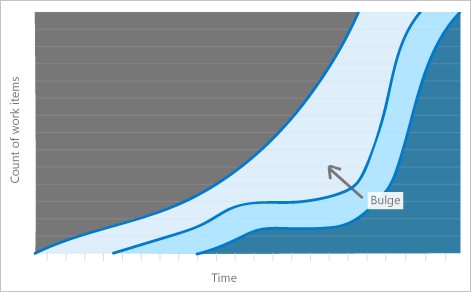
Is the team completing work at a steady pace? One way to tell is to look at the spacing between the various columns on the chart. Are they of a similar or uniform distance from each other from beginning to end? Do any columns appear to flatline over a period of multiple days? Or do any seem to bulge?
Mura, or unevenness, is the lean term for flat lines and bulges. Mura indicates a form of waste (Muda) in the system. Any unevenness in the system causes bulges to appear in the CFD.
Monitoring the CFD for flat lines and bulges supports a key part of the Theory of Constraints project management process. Protecting the slowest area of the system is referred to as the drum-buffer-rope process and is part of how work is planned.
Two problems show up visually as flat lines and as bulges.
Flat lines appear when the team doesn't update the status of their work items with a regular cadence. The board that you use to track and manage work provides the quickest way to transition work from one column to another.
Flat lines can also appear when the work across one or more processes takes longer than planned. Flat lines appear across many parts of the system because if only one or two parts have problems, you see a bulge.
Flat lines
Bulges occur when work builds up in one part of the system and doesn't move through a process.
For example, a bulge can occur when testing takes a long time but development takes less time. The result is that work accumulates in the development state. Bulges indicate that a succeeding step is having a problem, not necessarily the step in which the bulge is occurring.
Bulges
How do you fix flow problems?
You can solve the problem of a lack of timely updates by taking the following actions:
- Holding daily stand-ups
- Holding other regular meetings
- Scheduling a daily team reminder email
Systemic flat-line problems indicate a more challenging problem, although such problems are rare. Flat lines indicate that work across the system is stopped. Underlying causes can include the following issues:
- Process-wide blockages
- Processes taking a long time
- Work shifting to other opportunities that aren't captured on the board
One example of systemic flatlining can occur in a features CFD. Feature work can take significantly longer than work on user stories, because features are composed of several stories. In these situations, either the slope is expected (as in an earlier example), or the issue is well known and the team has already raised it. If it's a known issue, the problem resolution is outside the scope of this article.
Teams can proactively fix problems that appear as CFD bulges. The fix that's appropriate can depend on where the bulge occurs. As an example, suppose that the bulge occurs in the development process. The bulge might be happening because testing is taking significantly longer than writing code. Testers might also be finding a large number of bugs. When they continually transition the work back to the developers, the developers inherit a growing list of active work.
There are two potentially easy ways to solve this problem:
- Shift developers from the development process to the testing process until the bulge is eliminated.
- Change the order of work. Specifically, interweave work that can be done quickly with work that takes longer to do.
Look for basic solutions to eliminate the bulges.
Note
Because various scenarios can occur that cause work to proceed unevenly, it's critical that you perform an actual analysis of the problem. The CFD can tell you that a problem exists. It can also tell you approximately where the problem is, but you must investigate to get to the root causes. This guidance provides recommended actions that solve specific problems, but the solutions might not apply to your situation.
Did the scope change?
Scope changes apply to fixed-period CFDs only. The top line of the chart indicates the scope of work. A sprint is preloaded with the work to do on the first day. Changes to the top line indicate the addition or removal of work.
In one particular scenario, you can't track scope changes with a CFD. That scenario occurs when the same number of work items are added and removed on the same day. The line stays flat in this case.
To track scope changes in this case, take the following actions:
- Compare several charts with one another.
- Monitor specific issues.
- Use sprint burndown to monitor scope changes.
Is there too much WIP?
You can easily monitor the board to determine whether WIP limits are exceeded. You can also monitor WIP levels by using the CFD.
A large amount of WIP usually shows up as a vertical bulge. The longer that there's a large amount of WIP, the more the bulge expands into an oval shape. This behavior is an indication that the WIP is negatively affecting the cycle and lead time.
Here's a good rule of thumb for WIP: There should be no more than two items in progress per team member at any given time. The main reason for using a limit of two items, not a stricter limit, is that reality frequently intrudes on the software development process.
Sometimes it takes time to get information from a stakeholder or to acquire necessary software. There are any number of reasons why work can be halted. Having a second work item to pivot to can provide some leeway. If both items are blocked, it's time to raise a red flag to get something unblocked—not just switch to yet another item. As soon as there are a large number of items in progress, the person working on those items can have difficulty switching context. It's likely that they forget what they were doing, which can lead to mistakes.
Lead time versus cycle time
The following diagram illustrates how lead time differs from cycle time. Lead time starts when a work item is created and ends when the work item enters a Completed state category. Cycle time starts when a work item first enters an In Progress or Resolved state category. Cycle time ends when the work item enters a Completed state category.
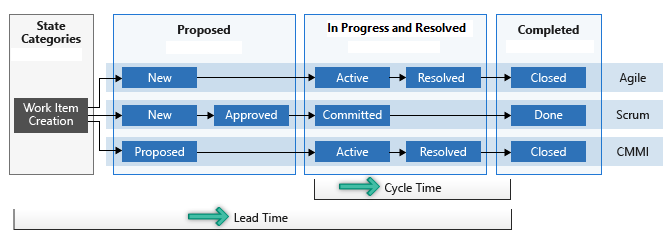
If a work item enters a Completed state category and then is reactivated, its lead and cycle times are affected. Any extra time it spends in a Proposed, In Progress, or Resolved state category contributes to its lead and cycle times.
If your team uses a board to track and manage work, it helps to understand how your columns map to workflow states. For more information on configuring your board, see Manage columns on your board.
For more information about how the system uses the state categories—Proposed, In Progress, Resolved, and Completed—see About workflow states in backlogs and boards.
Estimate delivery times based on lead and cycle times
You can use your average lead and cycle times and standard deviations to estimate delivery times.
When you create a work item, you can use your team's average lead time to estimate the completion date of that work item. Your team's standard deviation tells you the variability of the estimate. Likewise, you can use your cycle time and its standard deviation to estimate the completion of a work item after work begins.
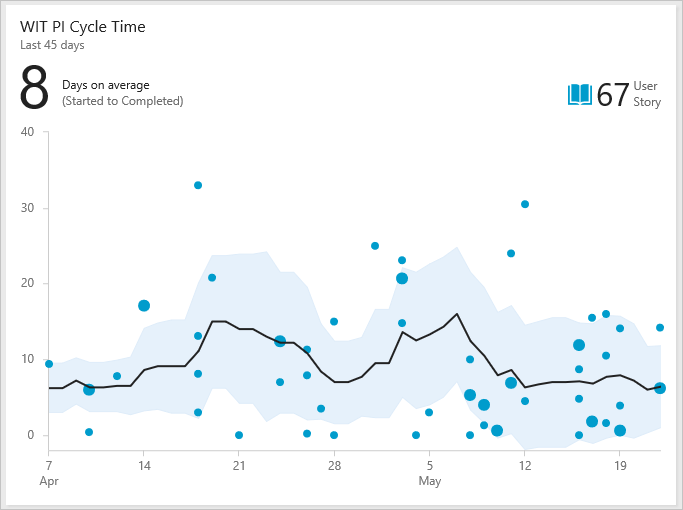
Example Cycle Time widget
In the following chart, the average cycle time is eight days. The standard deviation is six days. Using this data, you can estimate that the team completes future user stories about 2 to 14 days after they begin work. The narrower the standard deviation, the more predictable your estimates.
Identify process issues
Outliers often represent an underlying process issue. Examples include waiting too long to review pull requests or not resolving an external dependency quickly. Review your team's control chart for outliers.
Example Cycle Time widget showing several outliers
The following chart shows several outliers, because several bugs took longer than average to complete. Investigating why these bugs took longer might help uncover process issues. Addressing process issues can help reduce your team's standard deviation and improve your team's predictability.

You can also see how process changes affect your lead and cycle times. For example, on May 15, the team made a concerted effort to limit the WIP and address stale bugs. You can see that the standard deviation narrows after that date, showing improved predictability.