Note
Access to this page requires authorization. You can try signing in or changing directories.
Access to this page requires authorization. You can try changing directories.
Azure DevOps Services | Azure DevOps Server 2022 - Azure DevOps Server 2019
Cumulative flow diagrams (CFDs) provide a way for you to monitor the flow of work through a system. CFDs track the count of work items as they progressively move through various workflow states. These diagrams can show the flow of epics, features, user stories, issues, product backlog items, or requirements, depending on the process that you select for your project:
Two types of CFDs are available: the in-context report you can view from a team backlog or board and the CFD widget you can add to a dashboard.
In this tutorial, you:
- View and configure the CFD in-context report (Analytics)
- Configure the Cumulative Flow Diagram widget (Analytics)
Prerequisites
| Category | Requirements |
|---|---|
| Access levels | - Project member. - At least Basic access. |
| Permissions | - Team administrator or project administrator or specific dashboard permissions granted to you. - To add a widget to a team dashboard: Member of the team. |
| Feature enablement | Azure Boards enabled. If disabled, none of the work-tracking Analytics widgets are displayed. To re-enable it, see Turn a service on or off. |
| Task awareness | Awareness of any required or recommended tasks listed later in this article. |
| Category | Requirements |
|---|---|
| Access levels | - Project member. - At least Basic access. |
| Permissions | - Team administrator or project administrator or specific dashboard permissions granted to you. - To add a widget to a team dashboard: Member of the team. |
| Feature enablement | - Azure Boards enabled. If disabled, none of the work-tracking Analytics widgets are displayed. To re-enable it, see Turn a service on or off. - Analytics installed and enabled. Members of the Project Collection Administrators group can add extensions or enable the service. Organization owners are automatically members of this group. |
CFD usage
The CFD shows the count of items in each board column for a selected time period. From this chart, you can gain an idea of the amount of work in progress and your lead time. Work in progress tracks unfinished requirements. Lead time indicates the amount of time it takes to complete a requirement after work starts.

Note
The in-context report always uses the blue-green color theme. However, the Analytics-based Cumulative Flow Diagram widget supports various color themes.
For the CFD to provide useful information, you need to update the status of work items to reflect progress as it occurs. You can quickly make these updates through the board you use to track and manage work.
For more information about CFD usage, see Cumulative flow, lead time, and cycle time guidance.
Open your backlog from the web portal
Go to your organization, select your project (1), and then select Boards > Backlogs (2). In the team selector, select your team (3).

To select a different backlog, open the selector, and then take one of the following steps:
- Select a different team.
- Select View backlogs directory.
- Enter a keyword in the search box to filter the list of team backlogs for the project.

To view the in-context reports for the product backlog, select a backlog level that's appropriate for your process:
- For Agile, select Stories.
- For Basic, select Issues.
- For Scrum, select Backlog items.
- For CMMI, select Requirements.


View the CFD in-context report
CFD reports are available for product and portfolio backlogs. Each report offers interactive controls to provide each user with the view of interest to them.
To open the CFD for your product or portfolio backlog, select Analytics.
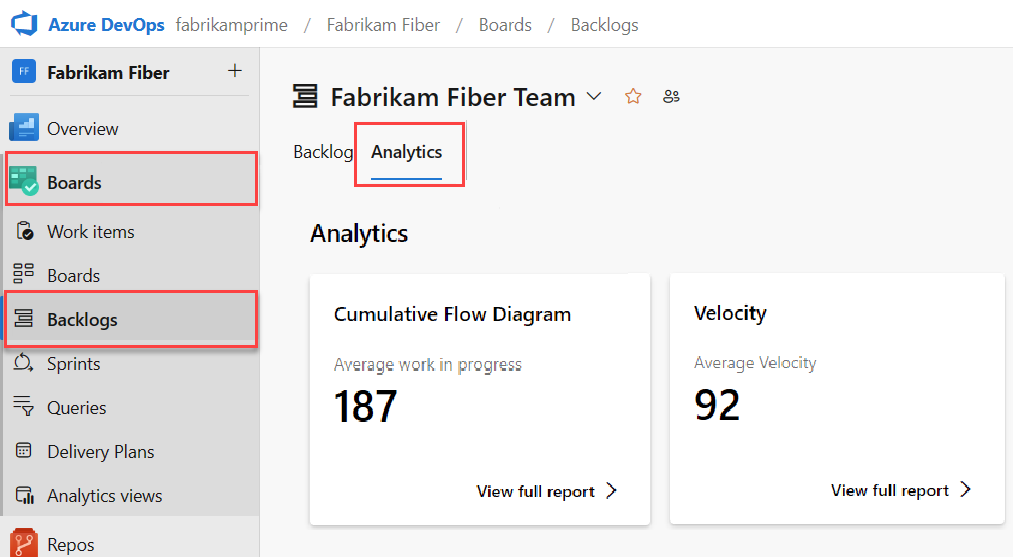
The average work in progress value excludes completed work items.
To select a portfolio backlog, select it from the backlog selector.

To view the CFD, select View full report.
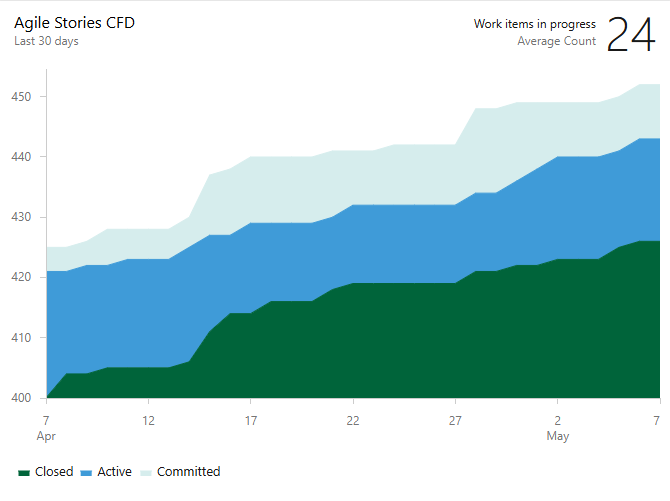
Use the interactive controls to select the time frame, swimlanes, and workflow states, or board columns. You can select a rolling period of anywhere between 14 and 180 days.
Hover over a point in time to show how many work items are in a particular state. For example, on July 3, 101 items were in a Research state.
By default, the average work in progress value is calculated by taking the average of the daily work in progress counts in the specified rolling period.

The selections you make are only set for you. They persist across sessions until you change them.
To add the report to a dashboard, select the
 More actions icon, and then select Copy to Dashboard.
Select the dashboard, and then select OK.
To return to the Analytics summary, select the
 back arrow.
Add the Cumulative Flow Diagram widget to your dashboard
Ensure your team's board is configured with defined columns and swimlanes that support your workflow processes.
If you want fixed-scope CFDs, make sure sprint iterations are defined for sprints of interest.
To add a CFD to your team dashboard, follow the steps in Add widgets to a dashboard, and use the Cumulative Flow Diagram widget.

Configure the CFD widget
On the Cumulative Flow Diagram widget, select the
 More actions icon, and then select Configure.
In the Configuration dialog, modify the title, and then select the values you want to monitor for the following fields:
- Team
- Backlog
- Swimlane
- Column

Configure the time period settings:
- For a continuous-flow CFD, select Rolling period (days), and then specify the number of days you want to view on the chart.
- For a fixed-scope CFD, select Start date, and then specify a start date. Select this view if your team employs a Scrumban process or follows a standard sprint process.
The main difference between these two types of CFDs is that the fixed-scope CFD provides information (in most cases) of scope change.
Select a color. You can distinguish CFDs for different teams by using a different color for each team.
Select Save. The following CFD shows 30 days of data.