Note
Access to this page requires authorization. You can try signing in or changing directories.
Access to this page requires authorization. You can try changing directories.
Azure DevOps Services | Azure DevOps Server 2022 - Azure DevOps Server 2019
In this quickstart, learn how to create, edit, and delete dashboards in Azure DevOps.
You can use dashboards to offer guidance and keep your team in sync. Configurable team or project dashboards provide visibility across your organization about progress, trends, and the status of work.
Dashboards also offer easy-to-read, real-time information that's easy to access. At a glance, you can use a dashboard to make informed decisions without having to drill down into other parts of your project.
Prerequisites
| Category | Requirements |
|---|---|
| Access levels | - Project member. - At least Basic access or specific dashboard permissions. |
| Permissions | To add, edit, or manage a team dashboard: A member of the team and a member of the Project Administrators group. |
| Category | Requirements |
|---|---|
| Access levels | - Project member. - At least Basic access or specific dashboard permissions. |
| Permissions | To add, edit, or manage a team dashboard: A member of the team and a member of the Project Administrators group. |
| Tools | For Analytics widgets to work with your dashboard: Analytics enabled. |
Note
Data displayed within a chart or widget is subject to the permissions granted to the signed-in user. For example, if a user doesn't have permissions to view work items under a specific area path, those items don't appear in query-based widgets on the dashboard. For more information, see FAQs on Azure DevOps dashboards, charts, and reports.
Project and team dashboards
All dashboards are associated with either a team or a project. When you add a dashboard, you can choose to make it a project dashboard or one that's specific to a team.
- Use project dashboards to display information or status updates about a project. Also use a project dashboard when you want to control who can edit the dashboard.
- Use team dashboards to focus on information that's specific to a team.
Note
The user who creates a project dashboard owns that dashboard. The owner can set permissions to specify who can edit the dashboard. Members of a project can view all dashboards.
A team dashboard is owned by the team administrator. Any member of the team can edit a team dashboard.
All widgets that are available to team dashboards are available for project dashboards. For team-specific widgets, if you can't select a team through the widget, the default project team is used in the widget.
When a project gets created, a default team and default team dashboard are created. The dashboard is labeled Overview. You can customize this dashboard by adding widgets. For more information, see Add, move, or delete a widget, later in this article.
Open the dashboard directory
In the dashboard directory, you can browse all dashboards. If a dashboard is a team dashboard, you can see which team it belongs to.
To open the dashboard directory, open a web browser and connect to your project. Then select Overview > Dashboards.
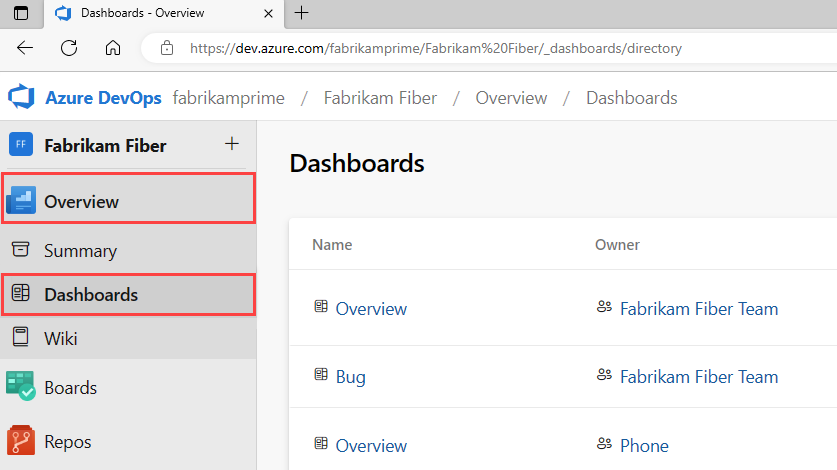
This page lists dashboards in the following order:
- The dashboard you last visited
- Dashboards in your favorites list
- All dashboards of teams that you belong to
- All dashboards defined for the project in alphabetical order
Select the ![]() filter icon to filter the list by keyword or team. Keywords apply to dashboard titles, descriptions, and team names.
filter icon to filter the list by keyword or team. Keywords apply to dashboard titles, descriptions, and team names.

If you need to switch to a different project, select the ![]() Azure DevOps logo to browse all projects.
Azure DevOps logo to browse all projects.
Select a dashboard
In the dashboard directory, you can select a dashboard from the list.
From an open dashboard, you can select a dashboard from the dashboard selector:
- To open the selector, select the name of the open dashboard.
- In the selector list, select the dashboard that you want to open.
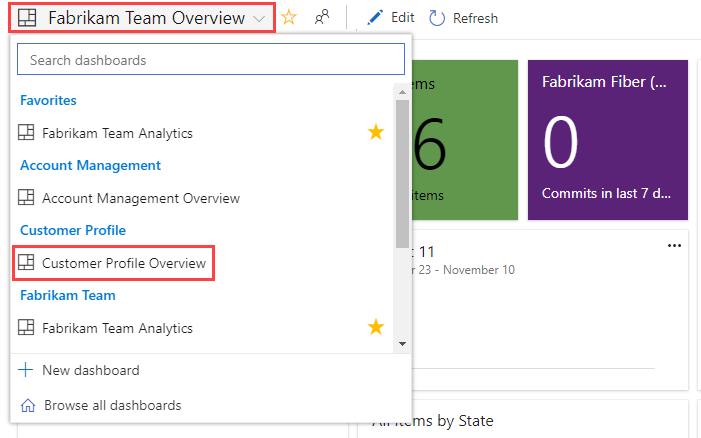
To return to the dashboard directory, open the dashboard selector, and then select Browse all dashboards.

Add a dashboard to your favorites list
To mark a dashboard as a favorite, take one of the following steps:
In the dashboard directory, select the star in the dashboard's row.
In the dashboard selector, hover over the dashboard, and then select the
 star icon.
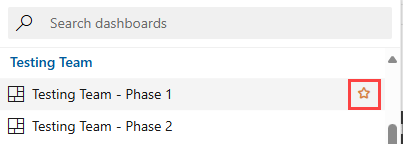
If you mark a dashboard as a favorite, it displays toward the top of the dashboard directory. It also appears under Favorites in the dashboard selector and in your personal favorites list.
Add a dashboard
You can add a new dashboard as needed to support your team's needs. You can also edit and rename any existing dashboards associated with your team.
Note
There's a limit of 500 dashboards per project. You receive an error message if you try to create a dashboard beyond that limit. To resolve the error, delete unused dashboards.
In the dashboard directory, select
 New Dashboard. Or, when viewing a dashboard, open the dashboard selector, and then select
New dashboard.
New Dashboard. Or, when viewing a dashboard, open the dashboard selector, and then select
New dashboard.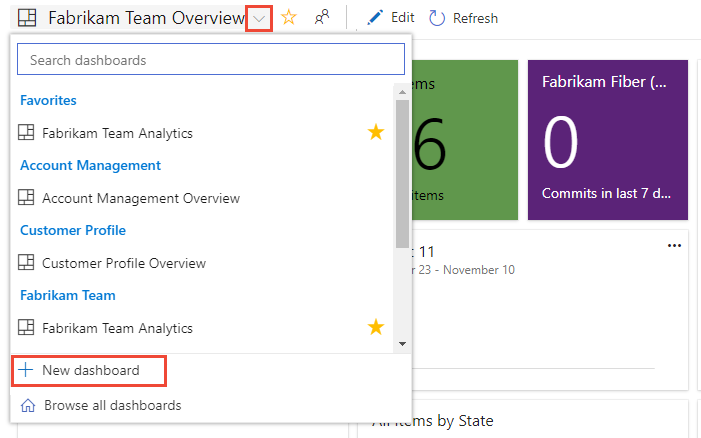
If you don't see the
New dashboard option, you're not a team admin for the currently selected team, or you don't have permissions to add and edit dashboards. Either switch the context to your team, or request to be added as a team admin.Enter the name of the dashboard and a description.
Under Dashboard Type, select Project Dashboard to create a project dashboard. To create a team dashboard, select Team Dashboard, and then select a team. For information about creating a team in Azure DevOps, see Create or add a team.
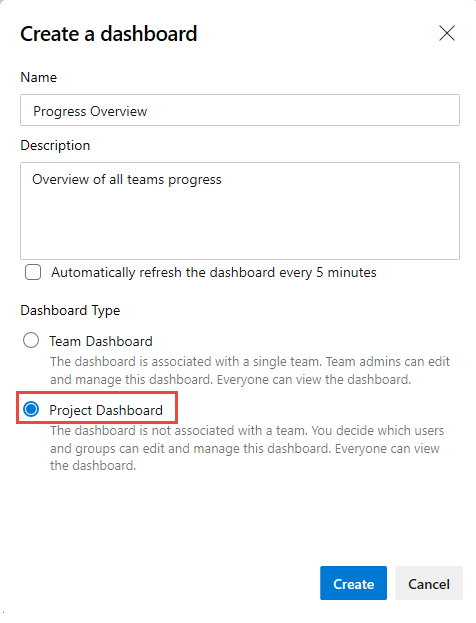
Select Create to create your dashboard. If you return to the dashboard directory, you see the new dashboard in the list.
For information about adding widgets to a dashboard, see Add, move, or delete a widget, later in this article.
Rename and delete dashboards and enable automatic refreshing
You can rename or delete a dashboard. And when you turn on the automatic refresh setting, the dashboard is automatically refreshed every five minutes.
Note
To delete a project dashboard, you must be a member of the Project Collection Administrators group.
To rename a dashboard, modify its description, or change its automatic refresh setting, take the following steps:
- Open the dashboard.
- Select
 More actions, and then select
  Dashboard settings.
 - Change the name, description, or automatic refresh setting, and then select Save.
To delete a dashboard, open the dashboard directory, select
More options for the dashboard, and then select Delete.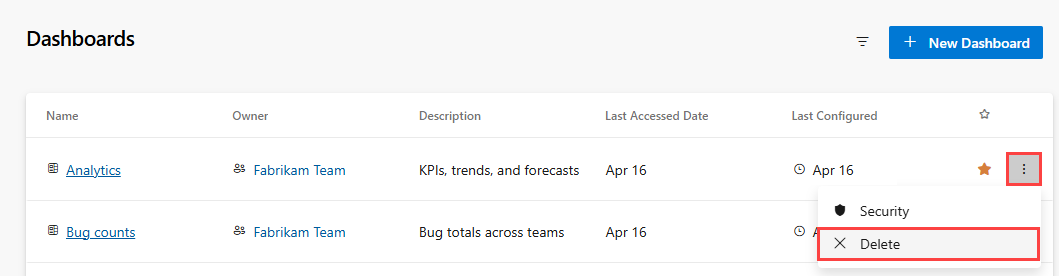
To set permissions for a dashboard, open the dashboard directory, select
More options for the dashboard, and then select Security. For more information, see Set dashboard permissions.

Add, move, or delete a widget
You can customize a dashboard by adding widgets. Widgets provide access to features and functions. For more information about widgets, see Out-of-box widget catalog.
When you add widgets to a dashboard, you can configure and resize each widget as needed. You can also move widgets around a dashboard to place them where you want them, and you can delete widgets.
To add, move, or delete a widget, open the dashboard, and then select ![]() Edit. The widget catalog opens.
Edit. The widget catalog opens.
To add a widget, drag a widget from the catalog onto your dashboard.
To rearrange widgets, drag the widget tiles to reorder their sequence on the dashboard.
To remove a widget, select
 Delete.
When you finish making changes, select Done Editing to exit dashboard edit mode.
Tip
When you're in dashboard edit mode, you can add, remove, rearrange, and configure widgets. When you leave edit mode, the widget tiles remain locked, reducing the chance of accidentally moving a widget.
Extensibility
By using the REST API service, you can create a dashboard widget. For more information about the REST APIs for dashboards and widgets, see Dashboards (API).