Note
Access to this page requires authorization. You can try signing in or changing directories.
Access to this page requires authorization. You can try changing directories.
Azure DevOps Services | Azure DevOps Server | Azure DevOps Server 2022 | Azure DevOps Server 2020
This quickstart shows how to create, edit, rename, and delete dashboards in Azure DevOps. It also covers permissions, adding widgets, and troubleshooting common issues.
Learn how to do the following tasks:
- Create team and project dashboards.
- Add, configure, move, resize, and remove widgets.
- Set dashboard permissions and sharing options.
- Troubleshoot common dashboard and widget issues.
Quick steps:
- In your project, open Overview > Dashboards.
- Select New dashboard to create a team or project dashboard.
- Select Edit, open the widget catalog, drag widgets onto the canvas, then select Done Editing.
- Open More options > Dashboard settings to rename or change refresh settings.
- Open More options > Security to set permissions.
Enable AI assistance for Azure DevOps
For enhanced productivity across your Azure DevOps workflow, use the Azure DevOps MCP Server to enable AI assistance with your project data. Get intelligent insights for daily standups, sprint planning, code reviews, project reporting, pull request analysis, and work item management—all through natural language queries to your AI assistant. For more information and installation instructions, see the Azure DevOps MCP Server overview.
Prerequisites
| Category | Requirements |
|---|---|
| Access levels | - Project member. - At least Basic access or specific dashboard permissions. |
| Permissions | To add, edit, or manage a team dashboard: A member of the team and a member of the Project Administrators group. |
| Category | Requirements |
|---|---|
| Access levels | - Project member. - At least Basic access or specific dashboard permissions. |
| Permissions | To add, edit, or manage a team dashboard: A member of the team and a member of the Project Administrators group. |
| Tools | For Analytics widgets to work with your dashboard: Analytics enabled. |
Note
Data displayed within a chart or widget is subject to the permissions granted to the signed-in user. For example, if a user doesn't have permissions to view work items under a specific area path, those items don't appear in query-based widgets on the dashboard. For more information, see FAQs on Azure DevOps dashboards, charts, and reports.
Project and team dashboards
Dashboards belong to either a team or a project.
- Use project dashboards to surface information at the project level and to control who can edit dashboards.
- Use team dashboards to surface information tailored to a team; team members typically edit these dashboards.
Note
- The user who creates a project dashboard becomes its owner and can set editor permissions. Deleting a project dashboard requires membership in the Project Collection Administrators group.
- Team administrators own team dashboards; team members can usually edit them depending on team settings.
- If a widget is team-scoped and lacks a team selector, the dashboard uses the project's default team.
When a project is created, Azure DevOps also creates a default team and a default team dashboard named Overview. Customize that dashboard by adding widgets.
Dashboard directory (browse dashboards)
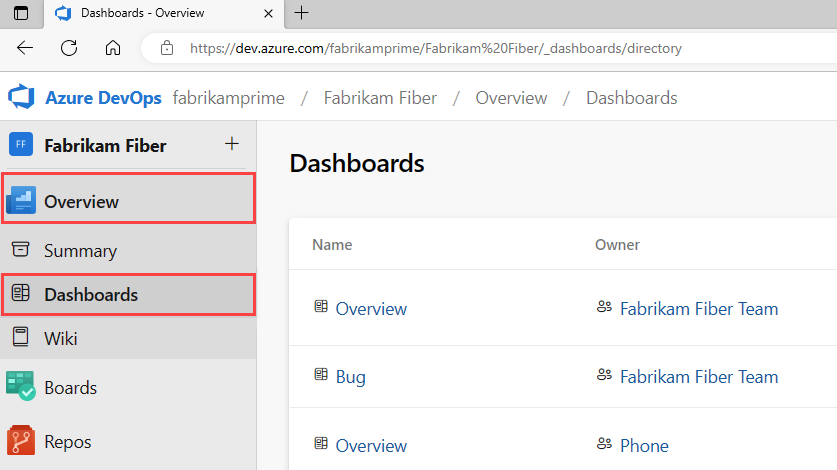
Open the dashboard directory to browse and manage dashboards for the current project:
- In your project, select Overview > Dashboards.
- Use the filter icon to search dashboards by title, description, or team.
- Use the dashboard selector (top-left) to switch dashboards or to select Browse all dashboards.
The directory lists dashboards in this order:
- The dashboard you last visited
- Dashboards in your favorites list
- Dashboards of teams you belong to
- All project dashboards alphabetically
Select and favorite a dashboard
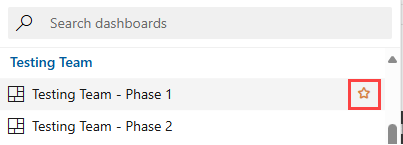
Open a dashboard from the directory or use the dashboard selector while viewing another dashboard. To add a dashboard to your favorites:
- Select the star in the dashboard row in the directory, or
- Hover over a dashboard in the selector and select the star icon.
Favorited dashboards appear near the top of the directory and in your personal favorites list.
Add a dashboard
You can add a dashboard at any time (subject to project limits).
Note
There's a limit of 500 dashboards per project. If you reach the limit, delete unused dashboards or consolidate widgets into fewer dashboards.
Steps to create a dashboard:
- In the dashboard directory, select the blue plus icon (New Dashboard). Or from any dashboard, open the dashboard selector and select New dashboard.
- Provide a name and optional description.
- Under Dashboard Type, choose Project Dashboard or Team Dashboard, and if needed, select the team.
- Select Create.
If you don't see New dashboard, you might not have permissions to create dashboards for the selected team. Switch context to a team where you're a team admin, or request team-admin rights. For help, see Create or add a team.

Rename, delete, and automatic refresh
Rename or update settings:
- Open the dashboard you want to change.
- Select More actions (⋯) > Dashboard settings.
- Change the name, description, or automatic refresh setting, then select Save.
Automatic refresh:
- When enabled, dashboards refresh automatically (typically every 5 minutes). Use automatic refresh for near real‑time widgets. Frequent refreshes across many dashboards can increase widget/API activity for large organizations.
Delete a dashboard:
- Open Overview > Dashboards to show the dashboard directory.
- In the directory, either:
- Hover a dashboard row and open More actions (⋯) > Delete, or
- Open the dashboard, then open More actions (⋯) on the dashboard and choose Delete.
- Confirm the delete action in the dialog.
Important
- To delete a project dashboard, you must be a member of the Project Collection Administrators group.
- To delete a team dashboard, you must have the appropriate team/dashboard permissions (team admin or explicitly granted delete rights).
The following screenshot shows the Delete action entry in the dashboard directory. Use the previous steps to navigate to the directory or the dashboard itself before following the screenshot.

Add, move, resize, or delete widgets
Widgets display data, charts, and actions on a dashboard.
To edit widgets:
- Open the dashboard.
- Select Edit to open the widget catalog.
- Drag a widget onto the canvas to add it.
- Use the widget toolbar to configure, resize, or remove a widget.
- Select Done Editing to save layout changes.
- Rearrange widgets by dragging tiles to new positions while in edit mode.
- Remove a widget from its menu by selecting Delete.

Tip
Use clear dashboard names and descriptions so people can discover the right dashboard. Group related widgets together and avoid adding too many widgets that refresh frequently.
Extensibility and automation
Developers can create custom widgets and automate dashboard tasks:
- Create or extend widgets using the Dashboard widget extension model: Add a dashboard widget.
- Manage dashboards programmatically with the Dashboards REST API.
Troubleshooting
- I can't create a dashboard: Check that you selected the correct team context and that you have team‑admin or project‑level permissions.
- I can't see or edit a dashboard: Verify project membership, team membership, and dashboard permissions (open More options > Security).
- Widget data is stale or empty: Verify the widget's data source and any required permissions (queries, analytics views, or service connections).
- Automatic refresh not updating: Confirm automatic refresh is enabled and that each widget's source supports refresh; try a manual page refresh.
- Can't delete a project dashboard: You must belong to Project Collection Administrators to delete project dashboards.
For a programmatic view of dashboard permissions or widget ownership, use the Dashboards REST API or check audit logs.
Best practices
- Keep dashboards focused: create one dashboard per scenario (status, triage, sprint health).
- Limit refresh frequency for dashboards that include expensive widgets or heavy queries.
- Use descriptive names and short descriptions to make dashboards discoverable.
- Share dashboards by adding links in team wiki pages or pinning them in team channels.
Accessibility
Design dashboards for accessibility:
- Use meaningful text labels for widgets and charts.
- Ensure sufficient color contrast and avoid conveying information by color alone.
- Add textual descriptions where a widget supports them.