Note
Access to this page requires authorization. You can try signing in or changing directories.
Access to this page requires authorization. You can try changing directories.
Azure DevOps Services | Azure DevOps Server 2022 | Azure DevOps Server 2020
To pull data into Power BI, we recommend that you use Open Data Protocol (OData) queries. OData is a standard that's established by the Organization for the Advancement of Structured Information Standards (OASIS) and approved by the International Organization for Standardization and the International Electrotechnical Commission (ISO/IEC). OData defines best practices for building and consuming REST APIs. For more information, see the OData documentation.
To get started quickly, see Overview of sample reports using OData queries. For information about other approaches, see About Power BI integration.
Power BI can run OData queries, which can return a filtered or aggregated set of data to Power BI. OData queries have two advantages:
- All filtering is done server-side. Only the data you need is returned, which leads to shorter refresh times.
- You can preaggregate data server-side. An OData query can carry out aggregations such as work-item rollup and build-failure rates. The aggregations are accomplished server-side, and only the aggregate values are returned to Power BI. By using preaggregation, you can carry out aggregations across large datasets without needing to pull all the detailed data into Power BI.
In this tutorial, you:
- Write and test OData queries.
- Run an OData query from Power BI.
Prerequisites
| Category | Requirements |
|---|---|
| Access levels | - Project member. - At least Basic access. |
| Permissions | By default, project members have permission to query Analytics and create views. For more information about other prerequisites regarding service and feature enablement and general data tracking activities, see Permissions and prerequisites to access Analytics. |
Use Visual Studio Code to write and test OData queries
The easiest way to write and test OData is to use Visual Studio Code with the OData extension. Visual Studio Code is a free code editor available on Windows, Mac, and Linux. The OData extension provides syntax highlighting and other functions that are useful for writing and testing queries.
Install Visual Studio Code and the OData extension
Install Visual Studio Code.
Open Visual Studio Code, select Extensions, and then search for odata. In the results list, select vscode-odata, and then install this extension.
In Visual Studio Code, create an OData file by creating an empty file that has the extension .odata. You can name it whatever you want, for example, filename.odata. But it must have an .odata extension to enable the OData extension functionality.
Write the OData query
Write the OData query. For example queries, see Overview of sample reports using OData queries.
The following query returns the top 10 work items under a specific area path. To use this query, replace {organization}, {project}, and {area path} with your values.
https://analytics.dev.azure.com/{organization}/{project}/_odata/v3.0-preview/WorkItems?
      $select=WorkItemId,Title,WorkItemType,State,CreatedDate
      &$filter=startswith(Area/AreaPath,'{area path}')
      &$orderby=CreatedDate desc
      &$top=10
To query across projects, omit /{project} entirely.
For more information, see Sample reports and quick reference index.
After you write the query in Visual Studio Code, you should see syntax highlighting.

Test the OData query
To test the OData query, place your cursor anywhere in the query text, and then select View > Command Palette.
In the search box, enter odata to bring up the OData commands.

Select OData: Open. This action combines the multiline query into a one-line URL, runs the query, and opens the results in your default browser.
The OData query result set is in JSON format. To view the results, install a JSON formatter extension for your browser. Several options are available for both Chrome and Microsoft Edge.

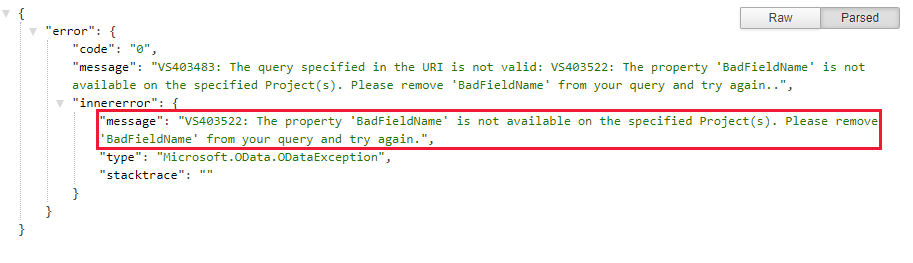
If the query has an error, the Analytics service returns an error in JSON format. For example, the following error states that the query selects a field that doesn't exist.


After you verify that the query works correctly, you can run it from Power BI.
Run the OData query from Power BI
To run the OData query from Power BI, take the steps in the following sections.
Combine the multiline OData query into a single-line query
Before you use the query in Power BI, you must convert the multiline OData query into a single-line query. To use the OData: Combine command for this purpose, take the following steps:
Make a copy of the OData file that contains your multiline query text. This step is recommended, because there's no way to convert the single-line query back to a readable multiline query.
In Visual Studio Code, open the copy of your OData file and place your cursor anywhere in the query text.
Select View > Command Palette. In the search box, enter odata. Then in the results list, select OData: Combine.
The multiline query gets converted into a single-line query.

Copy the entire line for use in the next section.
Run the query from Power BI
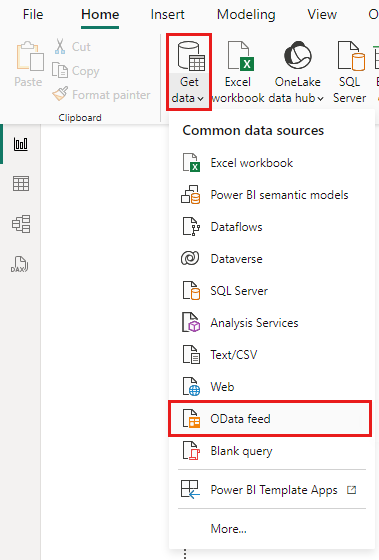
In Power BI, select Get data > OData feed. For more information, see Create a Power BI report with an OData query.
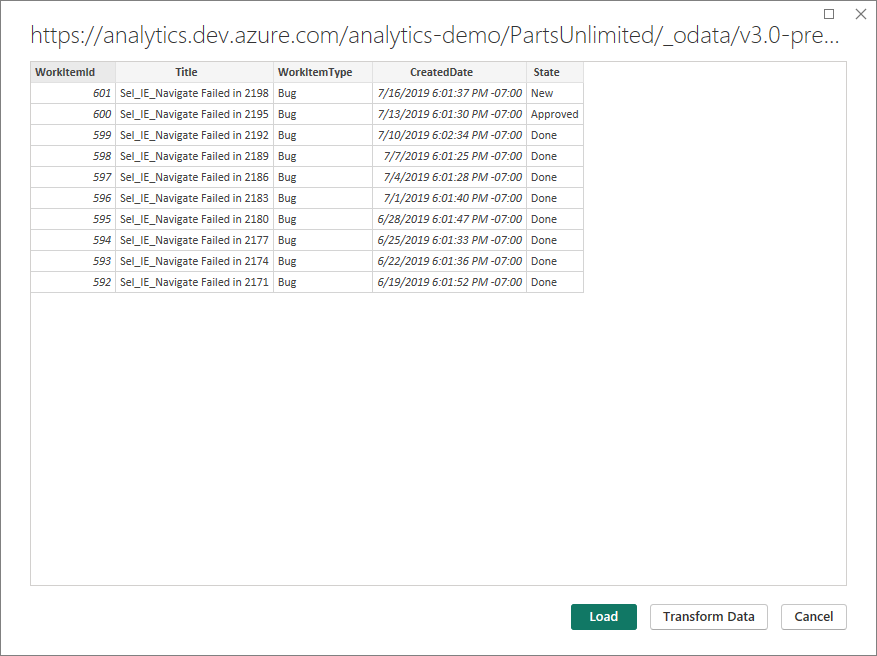
In the OData feed window, in the URL box, paste the OData query that you copied in the preceding section, and then select OK.

Power BI displays a preview page.
Specify query options
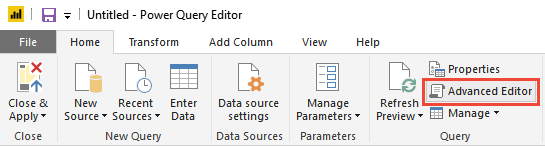
On the preview page, select Transform Data to open Power Query Editor.

On the ribbon, select Advanced Editor.
In the Advanced Editor window, scroll horizontally to view the
[Implementation="2.0"]parameter in the query.
Replace
[Implementation="2.0"]with the following string:[Implementation="2.0",OmitValues = ODataOmitValues.Nulls,ODataVersion = 4]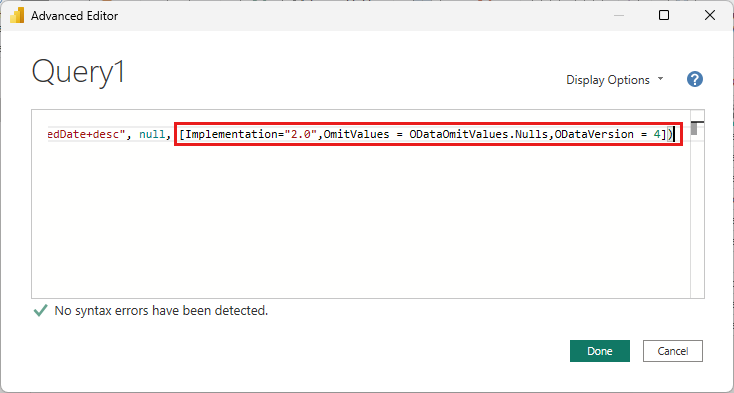
This change helps prevent throttling errors. The new values have the following effect:
- They instruct Power BI to reference OData version 4.
- They instruct the Analytics service to omit any values that are null, which improves query performance.
Power Query attempts to resolve null values as errors by generating another query for every null value it encounters. This action can result in thousands of queries. These queries can quickly exceed your usage threshold, beyond which your user account gets throttled.
Select Done to close the Advanced Editor and return to Power BI Power Query Editor. You can use Power Query Editor to perform the following optional actions:
- Rename the
Query1query as something more specific. - Transform columns to a specific type. Power BI automatically detects the type, but you might want to convert columns to a specific data type.
- Add computed columns.
- Remove columns.
- Expand columns into specific fields.
- Rename the

Create a report by using the data
Select Close & Apply to save your settings and pull the data into Power BI. After the data refreshes, you can create a report like you normally do in Power BI.