Note
Access to this page requires authorization. You can try signing in or changing directories.
Access to this page requires authorization. You can try changing directories.
Note
Connection Monitor for ExpressRoute is powered by Azure Network Watcher Connection Monitor. This article focuses on configuring Connection Monitor through the ExpressRoute portal experience. For comprehensive monitoring concepts, troubleshooting, and advanced configuration options, see the Network Watcher Connection Monitor documentation.
This article shows you how to configure Connection Monitor for your Azure ExpressRoute connections. Connection Monitor provides end-to-end visibility into your ExpressRoute connectivity by continuously testing network paths between on-premises and Azure endpoints using synthetic traffic.
To learn more about how Connection Monitor works, test configuration, regional considerations, and pricing, see Connection Monitor for ExpressRoute overview.
Note
If you don't see the Connection Monitor option when creating or editing an ExpressRoute connection, you may need to enable the feature flag. Access the Azure portal with this URL:
https://ms.portal.azure.com/?feature.experimentation=false&exp.AzurePortal_ExRCMIntegration=true#home
Prerequisites
Before you begin, ensure you have the following:
- An active ExpressRoute connection between your on-premises network and Azure
- Azure Monitor agent for on-premises endpoints: Install the Azure Monitor agent on any on-premises server that you intend to use as a source endpoint for connectivity testing.
- A TCP listener running on your on-premises servers (on the port you'll configure)
- Network Contributor role or equivalent permissions
Detailed permission requirements
The following permissions are required on the ExpressRoute connection subscription:
Resource Provider registration:
Microsoft.OperationalInsightsresource provider must be registered for the ExpressRoute connection subscription
Required role-based access control (RBAC) permissions:
Microsoft.Authorization/*/Read– Needed to fetch Azure role assignments and policy definitions- Network Contributor role – For Network Watcher RBAC and to create/manage alerts
Microsoft.HybridCompute/machines/write– Needed for selected on-premises Azure Arc machinesMicrosoft.Network/virtualNetworks/write– Needed for Azure endpointsMicrosoft.Resources/deployments/*– Needed for Azure Resource Manager (ARM) resource deploymentMicrosoft.OperationalInsights/workspaces/*– Needed for Log Analytics workspace operations
If Network Watcher isn't enabled in your ExpressRoute connection subscription/region:
- Contributor role OR
Microsoft.Resources/subscriptions/resourceGroups/write
Configure Connection Monitor
You can configure Connection Monitor when creating a new ExpressRoute connection or add it to an existing connection.
Create a new ExpressRoute connection with monitoring
Follow these steps to enable Connection Monitor while creating a new ExpressRoute connection:
Create the ExpressRoute connection by following the steps in Link a virtual network to ExpressRoute circuits.
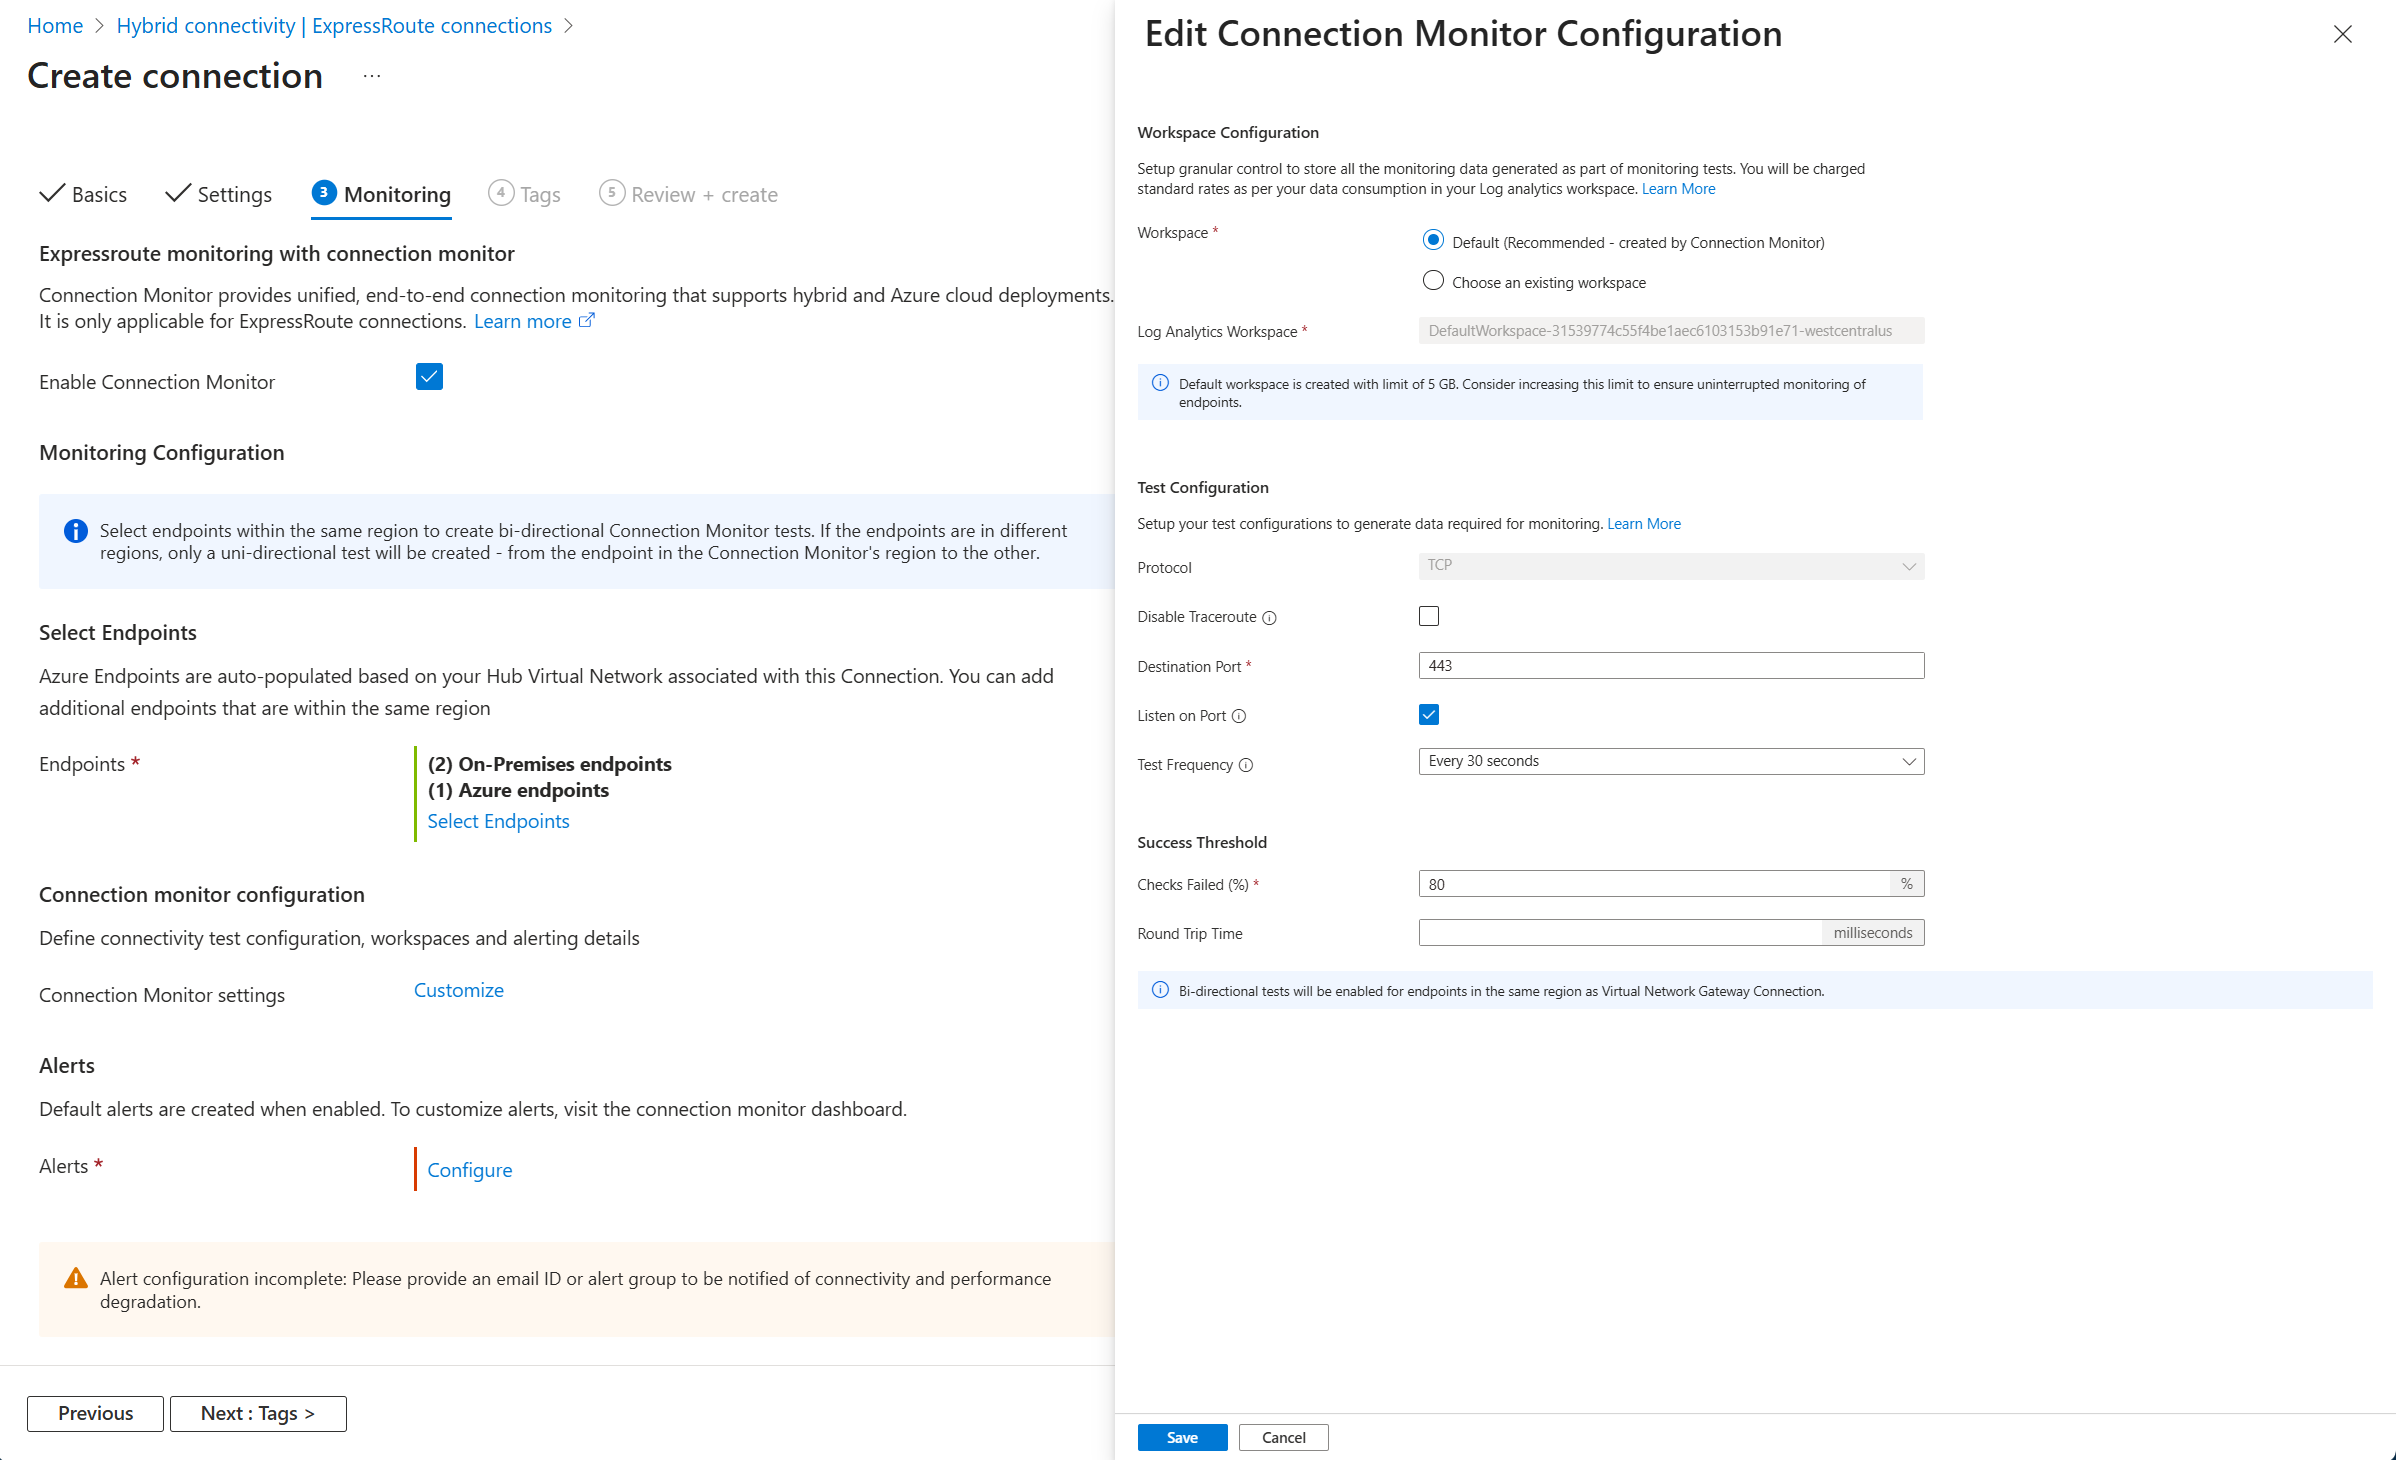
On the Monitoring tab during connection setup, configure the following settings:
The Enable Connection Monitor checkbox is selected by default. Clear it if you don't want to enable monitoring.
Select your on-premises and Azure endpoints. Both endpoints are required to define the test path. For detailed information about how endpoint selection affects test creation, see Connection Monitor overview.
On-premises endpoint: Select the on-premises endpoint for your connectivity tests. You can choose one or both options:
- Azure Arc-enabled endpoint: Select a server that has the Azure Monitor agent installed. This option supports bi-directional tests (the endpoint can act as both source and destination).
- External URL or IP address: Enter an external address that is reachable through your ExpressRoute connection. This option only supports uni-directional tests where the external address serves as the destination endpoint. If you don't have Arc-enabled servers yet, you can start with external addresses and upgrade to Arc later for bi-directional testing.
Azure endpoint: Select your Azure Virtual Machine (VM) or Virtual Machine Scale Set (VMSS) from the list of available Azure Virtual Networks. If you don't explicitly select a VM, Connection Monitor randomly samples a VM within the selected virtual network. Bi-directional tests are supported when the Azure endpoint is in the same region as the on-premises endpoint. Otherwise, only uni-directional tests are available. Endpoints in the same region as your ExpressRoute connection are auto-selected because they provide the most comprehensive test coverage.
Configure the test settings:
Protocol: The network protocol used for testing. Connection Monitor supports TCP to simulate application traffic on a specific port.
Disable traceroute: Select this checkbox to stop sources from discovering topology and hop-by-hop RTT.
Destination port: Enter the port your application uses.
Tip
Choose a port that reflects your actual application traffic for meaningful monitoring results. Common options include:
- Port 443 for HTTPS web applications
- Port 1433 for SQL Server databases
- Port 3389 for Remote Desktop Protocol (RDP)
- Port 22 for SSH connections
For best results, select the port used by your most critical workload over ExpressRoute.
Listen on port: Select this checkbox to open the chosen TCP port if it isn't already open.
Test Frequency: How often Connection Monitor checks your connection.
- 30 seconds: Best for mission-critical apps where you need immediate detection (uses more resources)
- 5 minutes: Good balance for most production environments
- 30 minutes: Adequate for non-critical monitoring
- Select Custom to enter another frequency from 30 seconds to 30 minutes
Success Threshold: Set thresholds to get alerted when performance degrades:
- Checks failed: The percentage of acceptable packet loss.
- Round-trip time: The maximum acceptable latency in milliseconds.
Select Review + create and then select Create to deploy the connection. The monitor is created only if the ExpressRoute connection deploys successfully.

Verify monitoring is configured
After you configure Connection Monitor, allow 5-10 minutes for the first test results to appear.
Quick verification checklist
Go to your ExpressRoute connection. In the left menu under Monitoring, select Connection Monitor.
Verify the following:
- ✅ Connection Monitor dashboard is visible
- ✅ Test status shows Pass or Warning (not Indeterminate after 10 minutes)
- ✅ Alerts column shows alert rules are created
- ✅ You can select an endpoint to view test details
Analyze monitoring data
For comprehensive guidance on analyzing your Connection Monitor data, including:
- Interpreting test results and status indicators
- Analyzing latency trends and packet loss metrics
- Viewing network path visualization and hop-by-hop analysis
- Troubleshooting common monitoring issues
- Using Log Analytics queries for custom analysis
See Analyze Connection Monitor data.
Monitor connection status and alerts
After Connection Monitor is configured, you can track connectivity status and receive alerts when issues occur.
View connection status
In the Azure portal, go to your ExpressRoute connection.
In the left menu, select Monitoring, then select Connection Monitor.
The dashboard shows the aggregated status for each endpoint based on test results from the past hour:
- Pass: All tests succeeded
- Fail: All tests failed
- Warning: Some tests failed (e.g., "2/6" means 2 out of 6 tests failed)
- Indeterminate: No test data found in Log Analytics
Select an endpoint to view:
- Individual test results
- The Reason column for failure causes
- Latency trends and packet loss metrics
- Network path visualization
Configure and manage alerts
Connection Monitor automatically creates Azure Monitor alerts when connectivity issues are detected. You can view, edit, and create custom alerts based on your monitoring needs.
To view or edit alert rules:
On the Connection Monitor dashboard, select the value in the Alerts column.
The alert rule definition opens where you can:
- Modify alert thresholds
- Change notification settings
- Add action groups
- Configure alert severity
For detailed information about default alerts, customizing alert conditions, creating alerts for performance metrics (RTT and packet loss), and detecting monitoring gaps, see Configure alerts for Connection Monitor.
Frequently asked questions
What's the difference between Azure Arc endpoints and external addresses?
Azure Arc endpoints automatically appear in the endpoint list if you have Azure Arc-enabled servers. When you select these servers, Connection Monitor creates bi-directional tests—from each Azure endpoint to each Arc server AND from each Arc server to each Azure endpoint.
External addresses are manually entered on-premises IP addresses. When you specify external addresses, Connection Monitor creates uni-directional tests only—from each Azure endpoint to each external address. No reverse-direction tests are created.
If you don't have Azure Arc-enabled servers yet, you can start with external addresses and upgrade to Arc later for bi-directional testing.
Why are some endpoints automatically selected during configuration?
Endpoints in the same region as your ExpressRoute connection are automatically selected because they provide the most comprehensive test coverage. You can manually select or deselect other endpoints from different regions as needed.
Why don't I see some of my virtual networks in the Azure endpoints list?
Only virtual networks that contain at least one VM or Virtual Machine Scale Set appear in the endpoint list. If your virtual network only has other resources (like App Service, Azure Kubernetes Service, or databases), it won't be listed.
Do tests run on all VMs in a virtual network?
No. Connection Monitor selects up to three VMs per virtual network. The Network Watcher Extension is automatically enabled on these VMs when you create the connection or update an existing connection with Connection Monitor enabled. You can't manually choose which specific VMs are used.
For more frequently asked questions about Connection Monitor, see Connection Monitor FAQ.