Note
Access to this page requires authorization. You can try signing in or changing directories.
Access to this page requires authorization. You can try changing directories.
Azure Route Server provides comprehensive monitoring capabilities through Azure Monitor, enabling you to track performance, monitor BGP peer connectivity, and analyze route propagation. This article shows you how to access and interpret Route Server metrics to maintain optimal network performance.
Azure Monitor provides centralized monitoring for all Azure services, including real-time metrics, alerting capabilities, and diagnostic insights for your Route Server deployment.
Note
Classic metrics are deprecated and not recommended for Route Server monitoring. Use Azure Monitor metrics for the best experience.
Prerequisites
Before you begin monitoring your Route Server, ensure you have:
- An Azure account with an active subscription. Create an account for free.
- An existing Azure Route Server deployment. If you need to create a Route Server, see Create and configure Azure Route Server.
- Appropriate permissions to view metrics in the Azure portal (Monitoring Reader role or higher).
Access Route Server metrics
To view Azure Route Server metrics in the Azure portal:
Sign in to the Azure portal.
Navigate to your Route Server resource.
In the left navigation pane, under Monitoring, select Metrics.
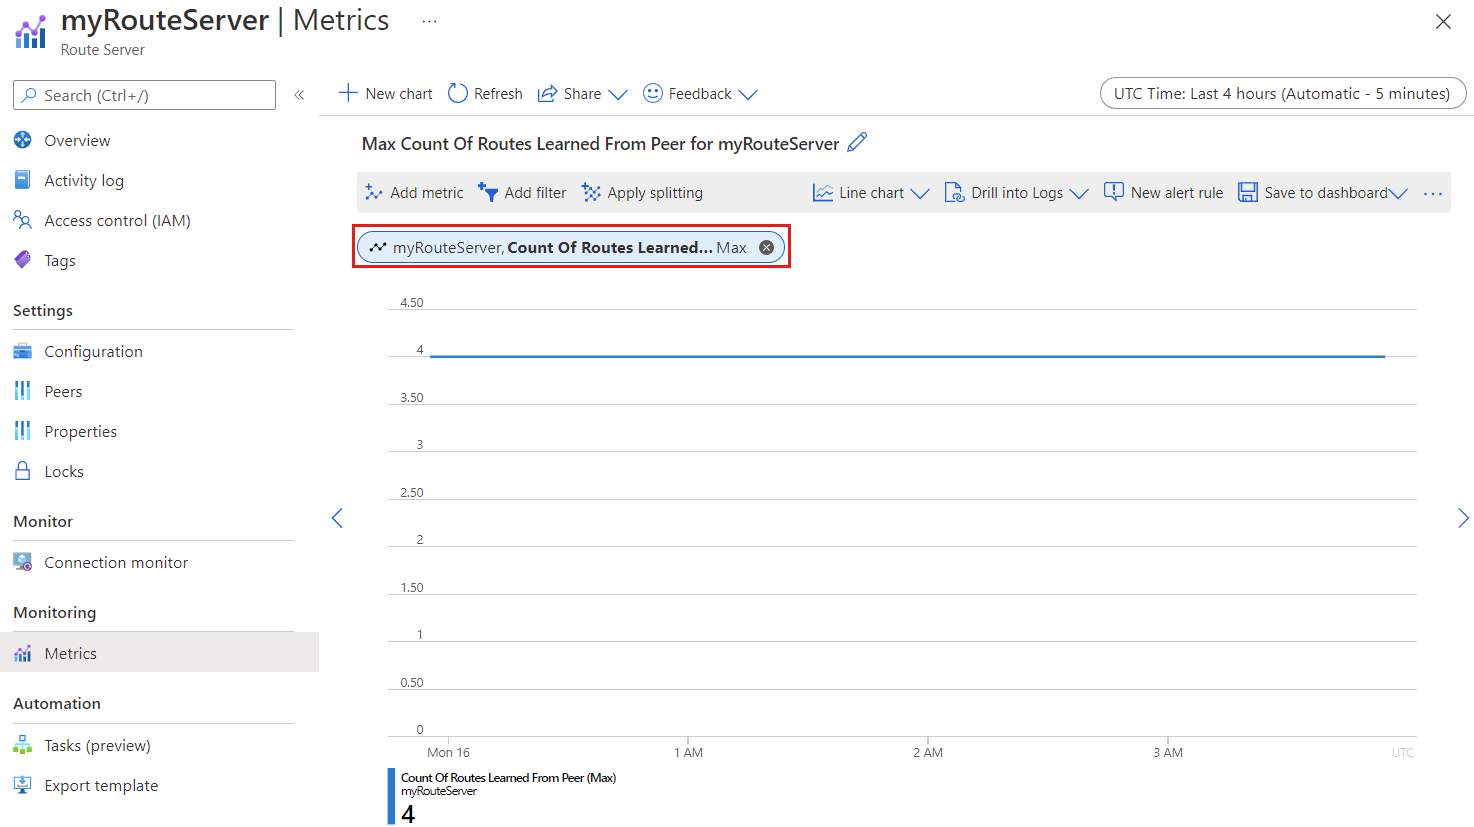
In the metrics explorer, select a metric from the Metric dropdown list. The default aggregation automatically applies based on the metric type.
Important
For optimal results when viewing Route Server metrics, select a time granularity of 5 minutes or greater in the time picker.

Understanding aggregation types
Azure Monitor metrics explorer supports multiple aggregation types for data analysis. Each Route Server metric uses a recommended aggregation type for accurate insights:
- Sum: The total of all values captured during the aggregation interval
- Count: The number of measurements captured during the aggregation interval
- Average: The mean of all metric values captured during the aggregation interval
- Minimum: The smallest value captured during the aggregation interval
- Maximum: The largest value captured during the aggregation interval
For more information about aggregation types, see Aggregation in Azure Monitor metrics charts.
Available metrics
The following table describes the metrics available for Azure Route Server monitoring:
| Metric | Category | Unit | Aggregation Type | Description | Dimensions | Exportable via Diagnostic Settings? |
|---|---|---|---|---|---|---|
| BGP Peer Status | Scalability | Count | Maximum | BGP availability from Route Server to Peer | BGP Peer IP, BGP Peer Type, Route Server Instance | Yes |
| Count of Routes Advertised to Peer | Scalability | Count | Maximum | Count of routes advertised from Route Server to Peer | BGP Peer IP, BGP Peer Type, Route Server Instance | Yes |
| Count of Routes Learned from Peer | Scalability | Count | Maximum | Count of routes learned from Peer | BGP Peer IP, BGP Peer Type, Route Server Instance | Yes |
Important
Azure Monitor includes a metric called Data Processed by the Virtual Hub Router that appears in Route Server monitoring. This metric doesn't apply to Route Server and should be ignored when monitoring your deployment.
Monitor specific metrics
The following sections provide detailed information about each Route Server metric and how to interpret the data.
BGP peer status
Recommended aggregation type: Maximum
The BGP peer status metric indicates the connectivity status between Route Server and your network virtual appliances (NVAs). This binary metric uses the following values:
- 1: BGP session is established and functioning
- 0: BGP session is down or unavailable
Monitor individual BGP peers
To view the BGP status for specific NVA peers:
- In the metrics chart, select Apply splitting.
- Choose BgpPeerIp from the dimension list.
- The chart displays separate lines for each BGP peer IP address.
Count of routes advertised to peer
Recommended aggregation type: Maximum
This metric displays the number of routes that Route Server advertises to your NVA peers. Monitor this metric to understand route propagation and verify that expected routes are being shared with your network appliances.
Count of routes learned from peer
Recommended aggregation type: Maximum
This metric shows the number of routes that Route Server learns from your NVA peers. Use this metric to monitor route learning and ensure your network appliances are properly advertising their routes.
Monitor routes from specific peers
To view routes learned from individual NVA peers:
- In the metrics chart, select Apply splitting.
- Choose BgpPeerIp from the dimension list.
- The chart shows route counts for each peer separately.
Set up monitoring alerts
To proactively monitor your Route Server deployment, consider creating alerts for critical metrics:
- BGP peer disconnection: Alert when BGP peer status equals 0
- Route count anomalies: Alert when route counts deviate significantly from baseline
- Peer availability: Alert when specific critical peers become unavailable
For detailed steps on creating alerts, see Create metric alerts in Azure Monitor.
Troubleshooting with metrics
Use Route Server metrics to diagnose common issues:
- BGP connectivity problems: Check BGP peer status and verify network connectivity
- Missing routes: Compare advertised vs. learned route counts to identify propagation issues
- Performance concerns: Monitor route counts against service limits
- Peer-specific issues: Use dimension splitting to isolate problems with individual NVAs
Next steps
Now that you understand how to monitor Route Server, explore these related articles:


