Note
Access to this page requires authorization. You can try signing in or changing directories.
Access to this page requires authorization. You can try changing directories.
APPLIES TO: Generally available in Business Central 2025 release wave 1 (version 26.x).
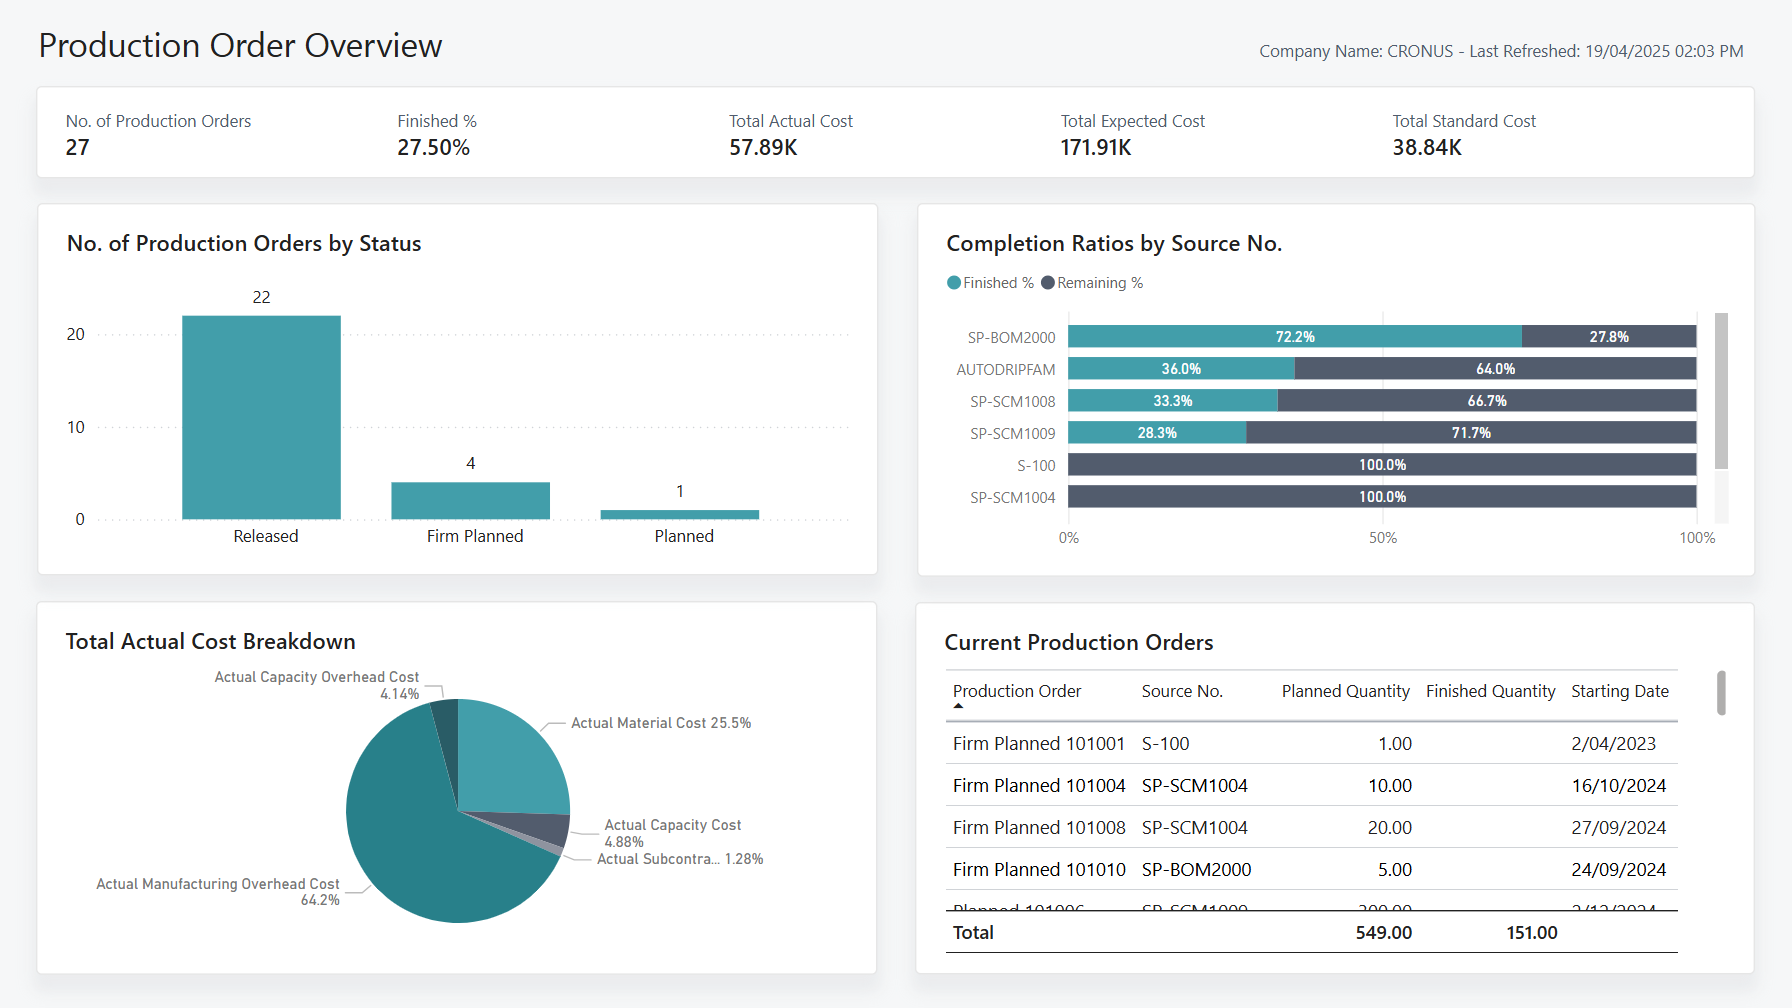
The Production Order Overview report provides a high-level summary of your organization's production order activities. This report filters out finished production orders so that it includes only current production order data. The report showcases key performance indicators (KPIs), such as:
- The number of production orders
- Completion rate measured as Finished %
- Actual Total Cost
- Total Expected Cost
- Total Standard Cost
The No. of Production Orders by Status chart arranges productions orders by status, allowing you to quickly explore the volume of documents at different stages of production.
The Completion Ratios by Source No chart shows the completion rate of each source item by showing the percentage of quantity finished versus remaining. Each bar represents a source item, making it easy to determine which source items are fully complete, partially complete, or yet to start. This helps you monitor progress at a glance and prioritize follow-ups for delayed or underperforming orders.
The Total Actual Cost Breakdown pie chart divides total actual cost into its sub-components:
- Actual Capacity Cost Overhead
- Actual Material Cost
- Actual Capacity Cost
- Actual Subcontracted Cost
- Actual Manufacturing Overhead Cost
This visualization helps manufacturing managers quickly understand where costs are concentrated for more informed cost control decisions.
The Current Production Orders table lists detailed information for each production order, including:
- Production Order Number
- Status
- Source No.
- Planned Quantity
- Finished Quantity
- Starting Date
The table provides more context when interacting with other visuals in the report, helping you examine specific orders for deeper analysis.
Use the report
Manufacturing managers and supervisors use this report to monitor the progress, cost, and status of production orders to ensure efficient and balanced operations.
Manufacturing managers rely on this report to track production order completion rates, evaluate actual production costs, and identify potential delays or cost overruns. The Completion Ratios by Source Number chart highlights which orders are progressing as expected and which might require follow-up. The Total Actual Cost Breakdown chart provides a clear view of cost distribution, helping you pinpoint major cost drivers and make informed decisions to control expenses.
Production supervisors use the Number of Production Orders by Status chart to track order volumes across stages of production, helping you identify workflow bottlenecks. The Current Production Orders table serves as a detailed reference for ongoing orders, allowing you to provide updates to management, verify progress, and support production scheduling.
Cross-highlighting between visuals provides additional context and insight. For example, selecting a specific status or production order updates the related charts and tables. This interactive capability allows you to drill down into specific areas of interest and better understand how individual orders contribute to overall performance.
Together, these visuals offer a comprehensive snapshot of production health, empowering teams to maintain output targets, control costs, and ensure timely delivery.
Key performance indicators (KPIs)
The Machine Center Load report includes the following KPIs and measures:
- Actual Capacity Cost
- Actual Capacity Cost Overhead
- Actual Manufacturing Overhead Cost
- Actual Material Cost
- Actual Subcontracted Cost
- Total Actual Cost
- Total Expected Cost
- Total Standard Cost
- No. of Production Orders
- Finished %
- Remaining %
Click on the link for a KPI to learn more about what it means, how it is calculated, and what data was used in the calculations.
Tip
You can easily track the KPIs that the Power BI reports display against your business objectives. To learn more, go to Track your business KPIs with Power BI metrics.
Data used in the report
The report uses data from the following tables in Business Central:
- Production Order Line
- Capacity Ledger Entry
- Item Ledger Entry
- Value Entry
- Inventory Adjustment Entry Order Line
- Production Order
Try the report
Try the report here: Production Order Overview
Tip
If you hold down the CTRL key while you select the report link, the report opens on a new browser tab. In this way, you can stay on the current page while you explore the report on the other browser tab.
Related information
Track your business KPIs with Power BI metrics
Power BI Manufacturing app
Built-in production reports
Manufacturing overview
