Note
Access to this page requires authorization. You can try signing in or changing directories.
Access to this page requires authorization. You can try changing directories.
APPLIES TO: Generally available in Business Central 2025 release wave 1 (version 26.x).
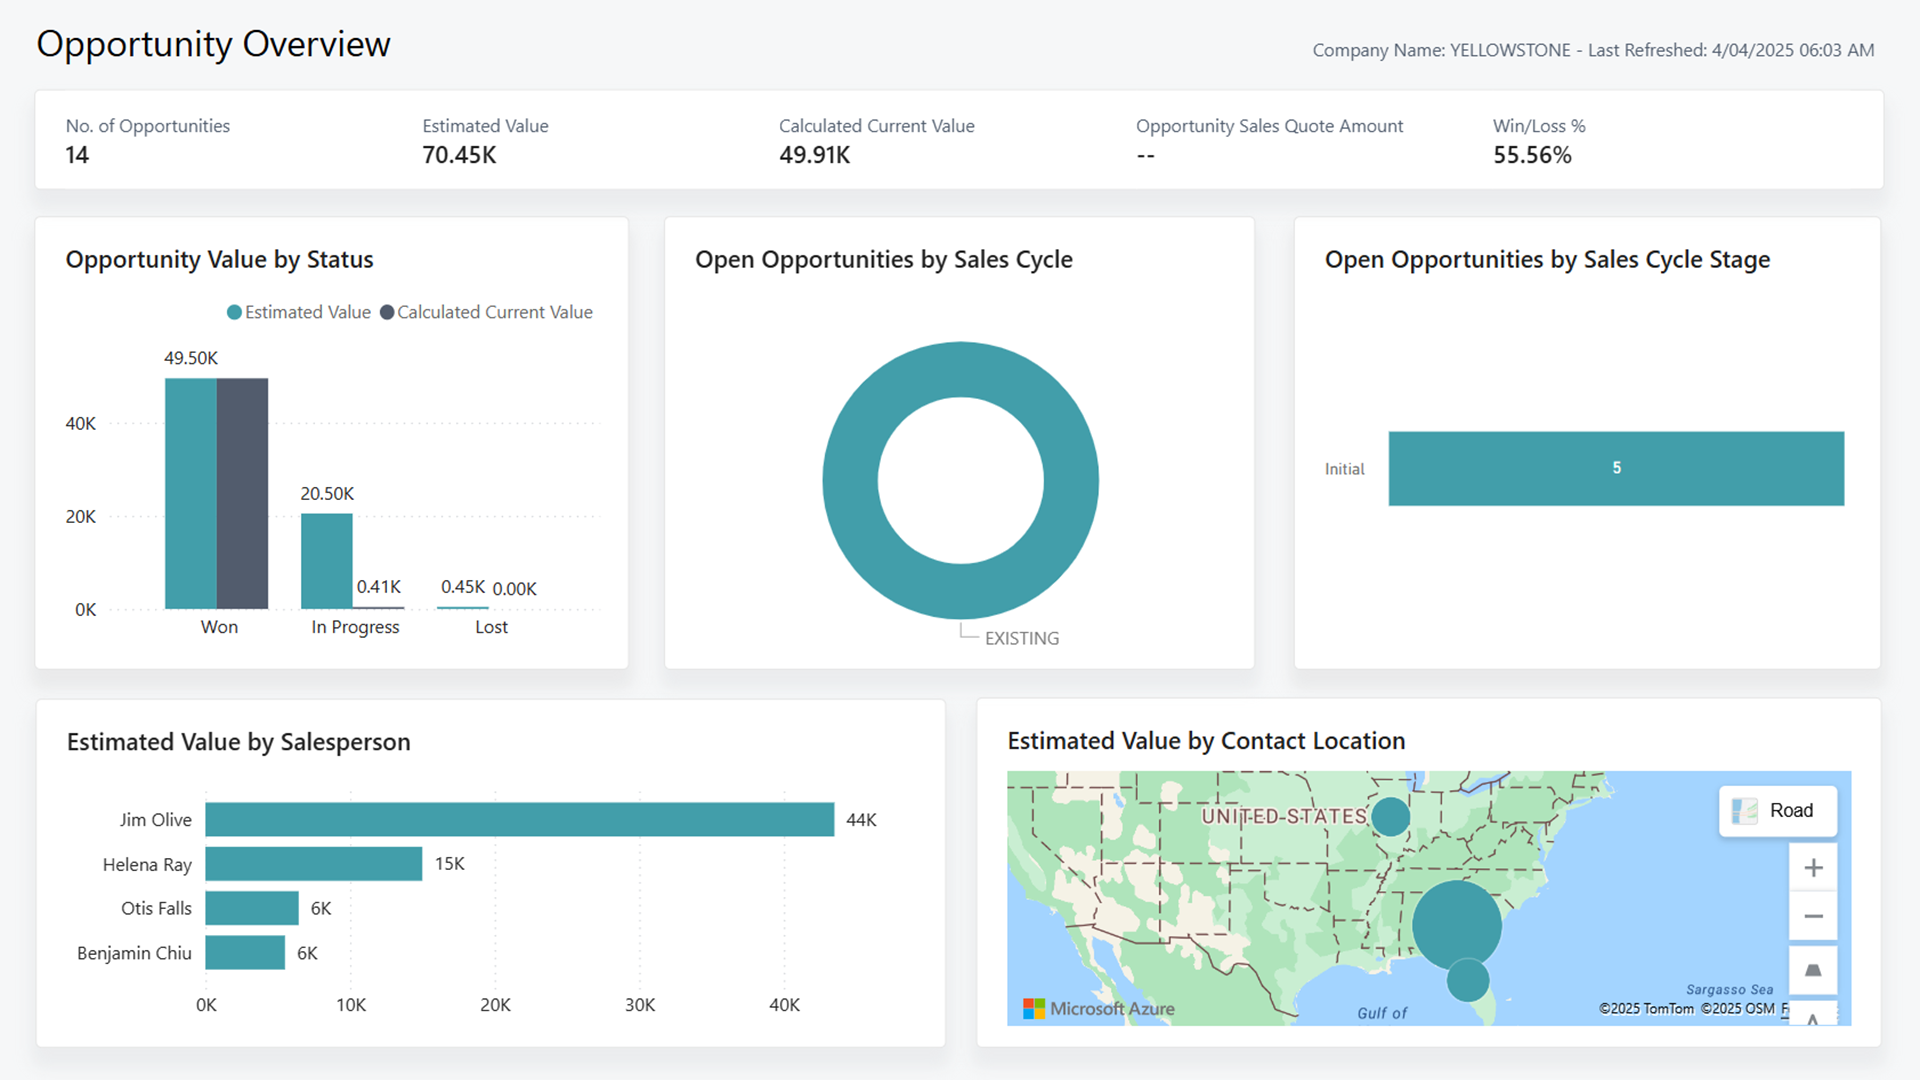
The Opportunity Overview report provides a comprehensive view of sales opportunities, including the number of opportunities, estimated values, sales cycle, and a breakdown of potential value by ___location. This report gives key insights into opportunity progression, prospect demographics, and the performance of closed opportunities.
Use the report
Management and sales teams use this report to track ongoing opportunities and the value they're expected to generate.
As a sales manager, you want to oversee the opportunity pipeline and monitor the performance of salespeople. Using this report, you can review the value by ___location and sales cycle stage, and identify demographics to focus on. This can help you grow future sales and inform you on where to invest in new marketing campaigns. Additionally, you can analyze key metrics for each salesperson to provide support.
For example, by reviewing the Win/Loss %, you might identify a salesperson who is underperforming. Using this information, you invest in further training and mentorship to improve their opportunity outcomes and overall profitability.
As a salesperson, the Opportunity Overview helps you to monitor your sales performance and manage opportunity progress. Using the sales cycle and ___location information, you're encouraged to nurture a diverse portfolio of prospects. Meanwhile, insights from the sales cycle stage motivate you to take action on tasks and advance opportunities.
For example, you might identify an opportunity in the initial stage that has high estimated value. With this knowledge, you decide to prioritize the opportunity and re-engage with the contact to reinforce the client relationship and progress the opportunity.
Key Performance Indicators (KPIs)
The report includes the following key performance indicators (KPIs) and measures:
- Calculated Current Value
- Estimated Value
- No. of Opportunities
- Opportunity Sales Quote Amount
- Win/Loss %
Click on the link for a KPI to learn more about what it means, how it is calculated, and what data was used in the calculations.
Tip
You can easily track the KPIs that the Power BI reports display against your business objectives. To learn more, go to Track your business KPIs with Power BI metrics.
Data used in the report
The report uses data from the following tables in Business Central:
- Contact
- Opportunities
- Opportunity Entries
- Sales Line
Try the report
Try the report here: Opportunity Overview
Tip
If you hold down the CTRL key while you select the report link, the report opens on a new browser tab. In this way, you can stay on the current page while you explore the report on the other browser tab.
Related information
Track your business KPIs with Power BI metrics
Ad-hoc analysis of sales data
Built-in sales reports
Sales analytics overview
Sales overview
