Note
Access to this page requires authorization. You can try signing in or changing directories.
Access to this page requires authorization. You can try changing directories.
APPLIES TO: Generally available in Business Central 2025 release wave 1 (version 26.x).
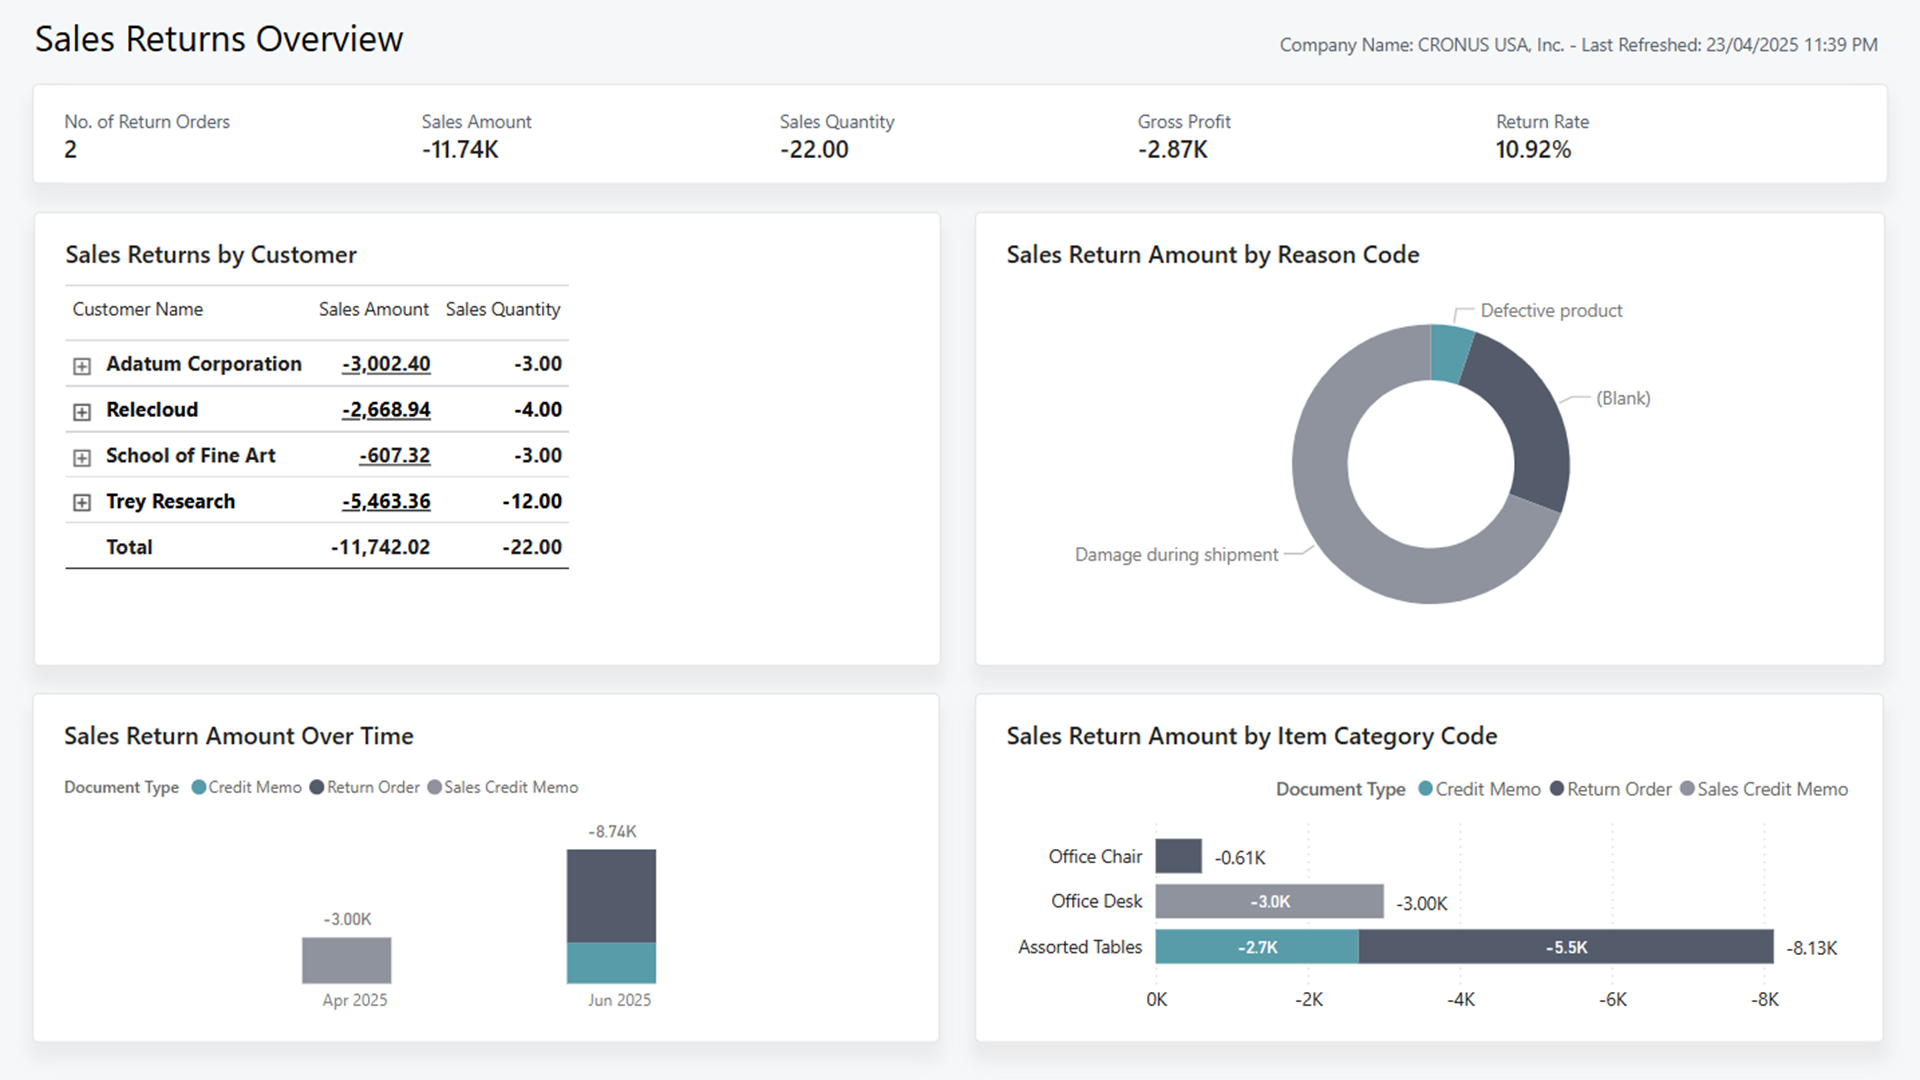
The Return Order Overview report tracks and analyzes return orders, providing insights into return amounts, quantities, reasons for return, and the financial effect on the organization. The report gives a high-level summary of return trends for item categories and customers, and analyzes the return amount over time.
Use the report
Leadership and management teams use the report to identify key factors that cause return orders and credit memos.
For CEOs, you want to evaluate return trends to inform key business decisions. For example, you identify 60% of return reasons are attributed to damage during delivery. In response, you engage a new logistics partner to optimize shipping procedures and minimize product returns.
As a product manager, you want to identify the item attributes which contribute the most to return orders, to inform future product development. By analyzing the return amount, you identify a specific item category with lower profitability. These insights help identify a persistent component fault and implement production process improvements to reduce item defects.
As a salesperson, this report helps you monitor individual customer returns, to assist with managing client relationships. Using this report, you notice that a particular customer has the highest Return Rate and their return amount increased over the past month. Using this information, you decide to offer a special discount to rebuild client trust in the business.
Key performance indicators
The report includes the following key performance indicators (KPIs) and measures:
Click on the link for a KPI to learn more about what it means, how it is calculated, and what data was used in the calculations.
Tip
You can easily track the KPIs that the Power BI reports display against your business objectives. To learn more, go to Track your business KPIs with Power BI metrics.
Data used in the report
The report uses data from the following tables in Business Central:
- Sales Line
- Value Entry
- Customer
- Item Category
- Reason Code
Try the report
Try the report here: Return Order Overview
Tip
If you hold down the CTRL key while you select the report link, the report opens on a new browser tab. In this way, you can stay on the current page while you explore the report on the other browser tab.
Related information
Track your business KPIs with Power BI metrics
Ad hoc analysis of sales data
Built-in sales reports
Sales analytics overview
Sales overview
