Note
Access to this page requires authorization. You can try signing in or changing directories.
Access to this page requires authorization. You can try changing directories.
APPLIES TO: Generally available in Business Central 2025 release wave 1 (version 26.x).
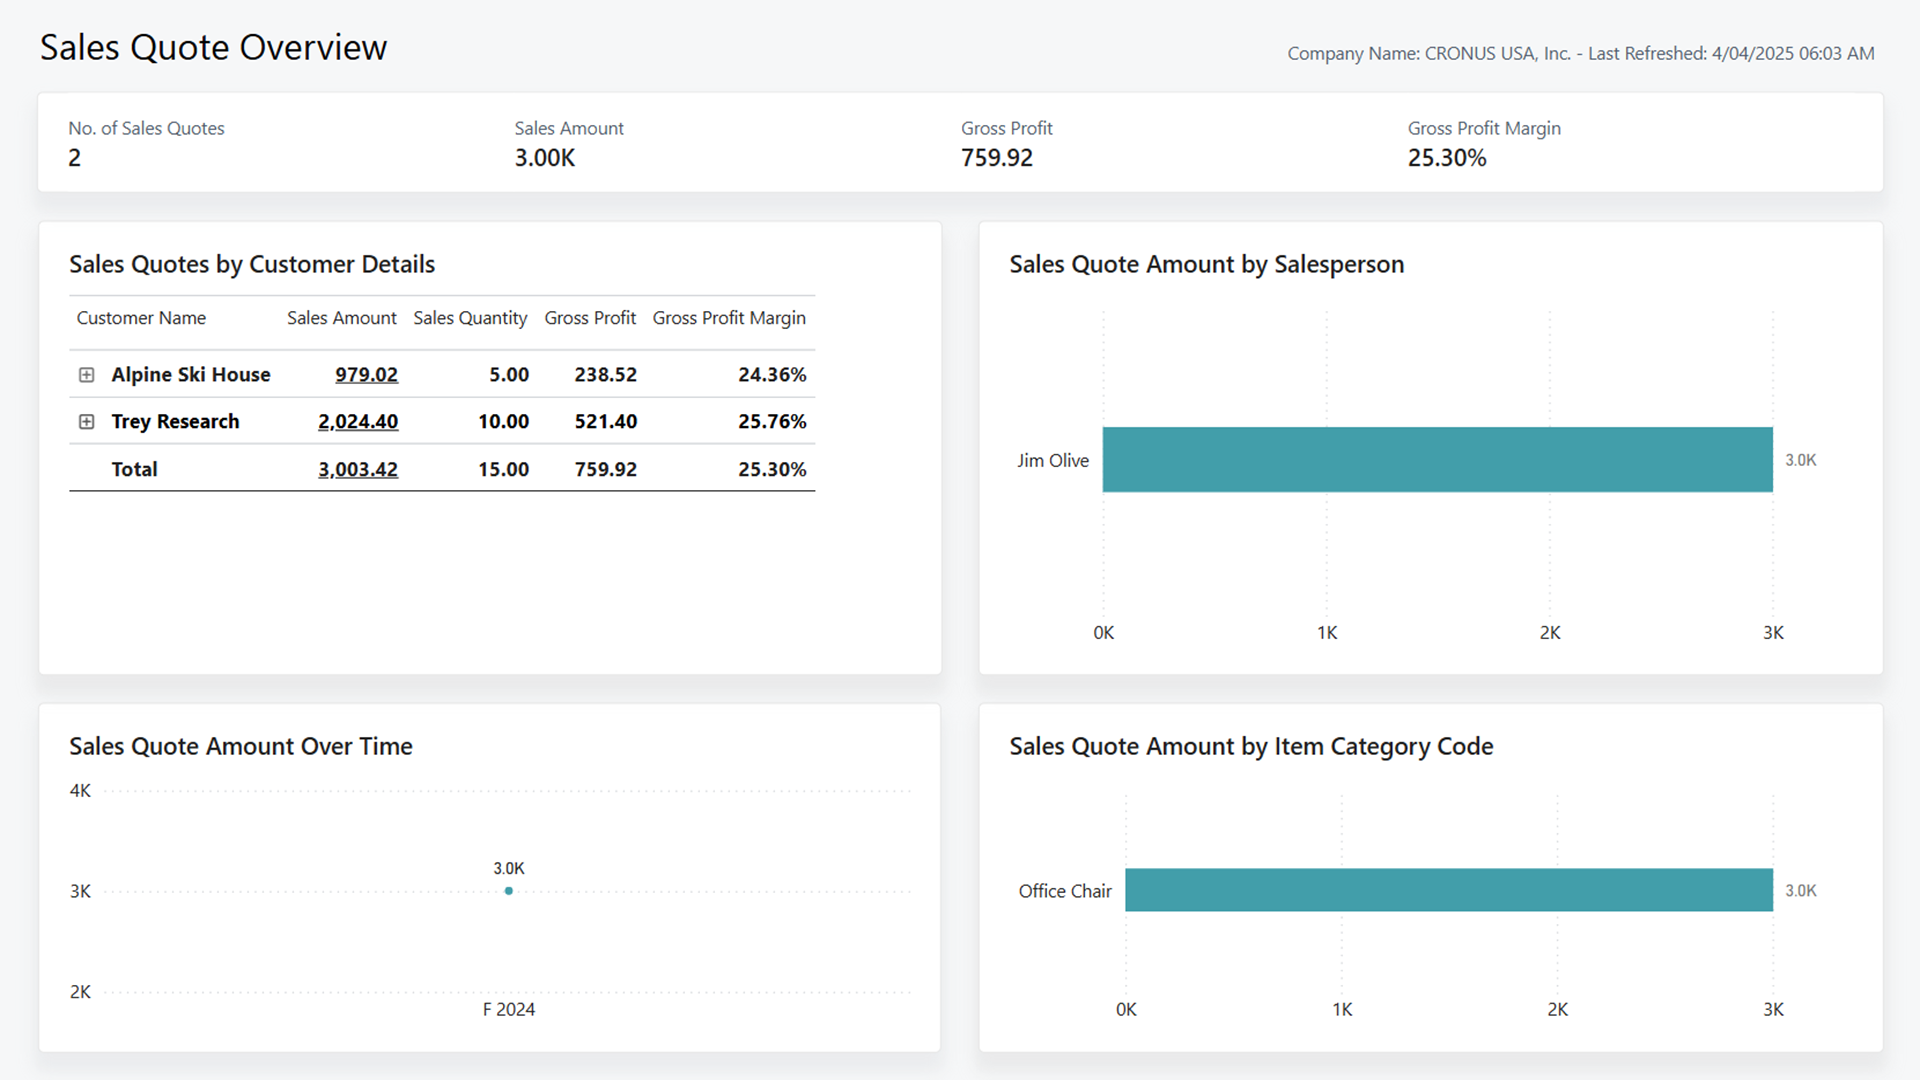
The Sales Quote Overview report provides detailed information on your organization's sales quotes for customers and prospects. The report highlights the number of quotes, total value, profit rates, and sales quote amount over time. Additionally, this report provides a quick view of sales quote documents by customer, and sales quote amount by salesperson and by item category, to help you gain insights into upcoming sales performance.
Use the report
Management and sales teams use this report to track the organization's prospective sales. The report helps you ensure the business is on track to meet budget goals and maintain profitability.
As a sales manager, you might want to monitor the performance of salespeople and their responsibility for upcoming sales. With these insights, you can take actions to delegate a particular salesperson's workload and responsibilities. Meanwhile, the sales quote amount over time can prepare you for upcoming periods with decreased profitability. This information can empower you to seek new prospects or prepare campaigns to promote future sales.
As a salesperson, you can use the report to review your upcoming sales performance and identify areas of improvement. Additionally, analyzing the sales quote amount by item category might give you insights into higher-performing items during the sales quote stage. That information ight help you focus your sales pitches towards items with higher engagement.
Key performance indicators
The report includes the following key performance indicators (KPIs) and measures:
Click on the link for a KPI to learn more about what it means, how it is calculated, and what data was used in the calculations.
Tip
You can easily track the KPIs that the Power BI reports display against your business objectives. To learn more, go to Track your business KPIs with Power BI metrics.
Data used in the report
The report uses data from the following tables in Business Central:
- Sales Line
- Customer
- Item
- Salesperson/Purchaser
Try the report
Try the report here: Sales Quote Overview
Tip
If you hold down the CTRL key while you select the report link, the report opens on a new browser tab. In this way, you can stay on the current page while you explore the report on the other browser tab.
Related information
Track your business KPIs with Power BI metrics
Ad hoc analysis of sales data
Built-in sales reports
Sales analytics overview
Sales overview
