Note
Access to this page requires authorization. You can try signing in or changing directories.
Access to this page requires authorization. You can try changing directories.
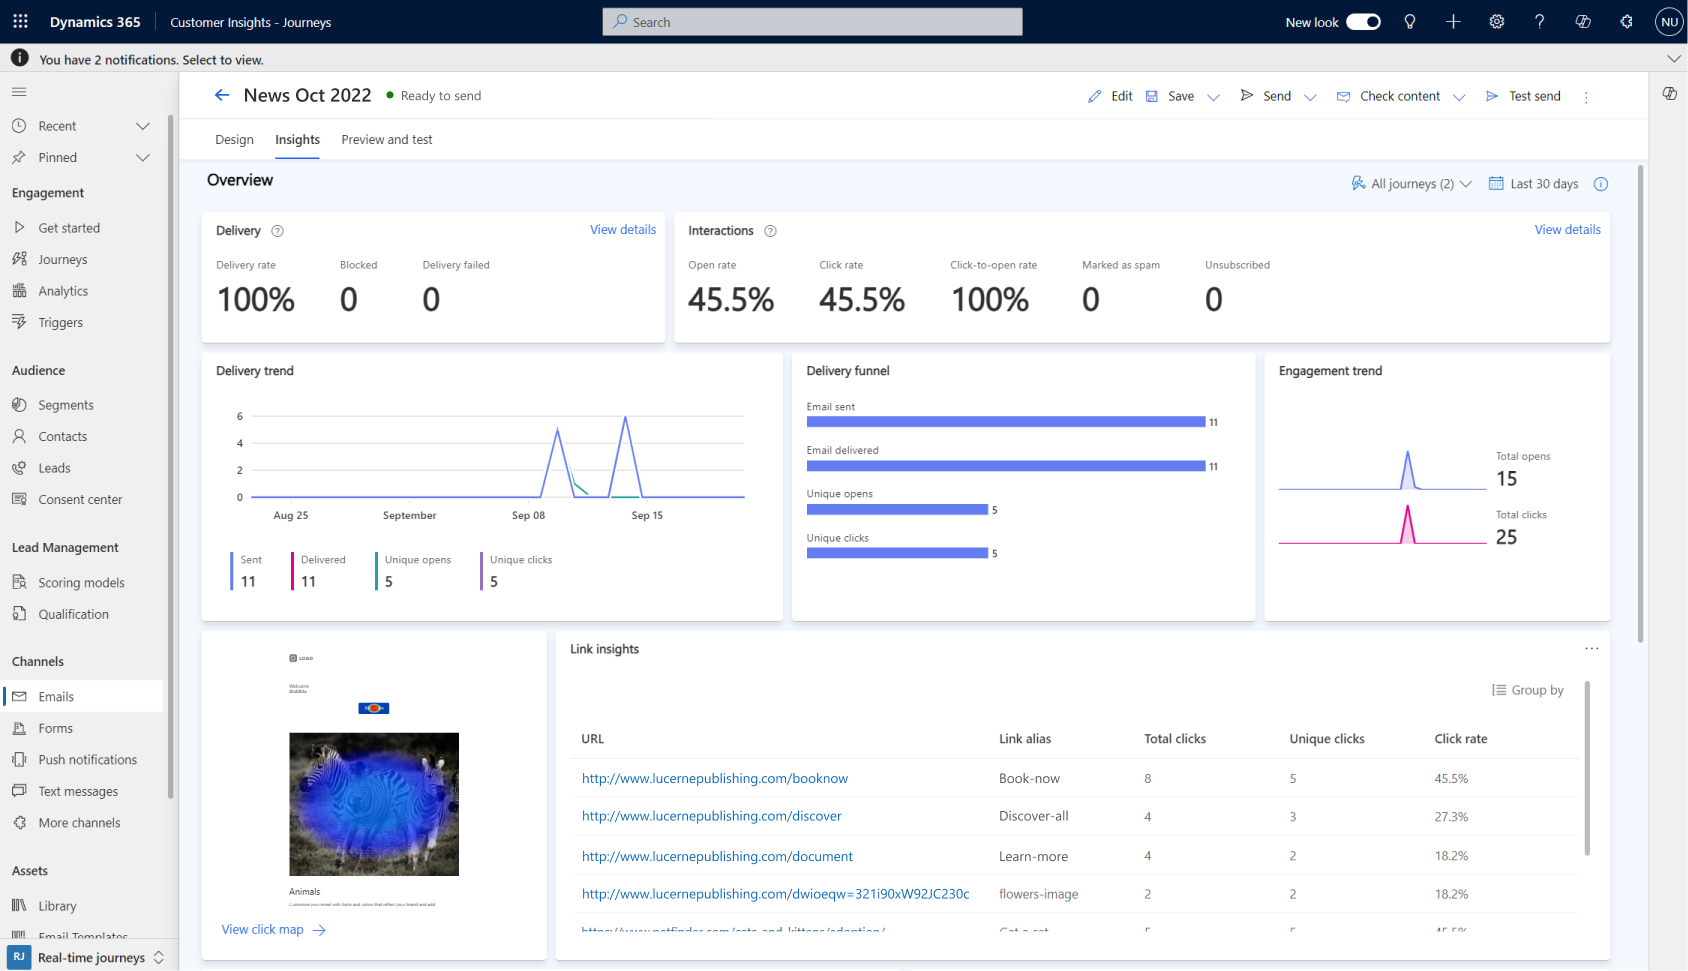
Email insights provide a deep dive into how your audience interacts with your emails over time and allow you to track the trajectory of delivery rates, open rates, and click-through rates with precision. Beyond delivery and engagement trends, you can evaluate essential email KPIs and access comprehensive delivery and interaction details.
To view email insights, go to Real-time journeys > Email > Insights.
Note
Email insights show interaction data for the last 12 months only. All historical interaction data is still stored.
Email delivery and interactions
- Delivery KPIs: See the delivery rate, number of blocks, and delivery failures for the selected message.
- Interactions KPIs: Check the open rate, click rate, click-to-open rate, number of messages marked as spam, and count of unsubscriptions for the selected message.
- Delivery trend and delivery funnel: View trends and the funnel of sent and delivered interactions, along with unique opens and unique clicks for the selected email.
- Engagement trend: Track trends for total opens and clicks to better understand engagement for the selected email.
Device type and user agent analysis
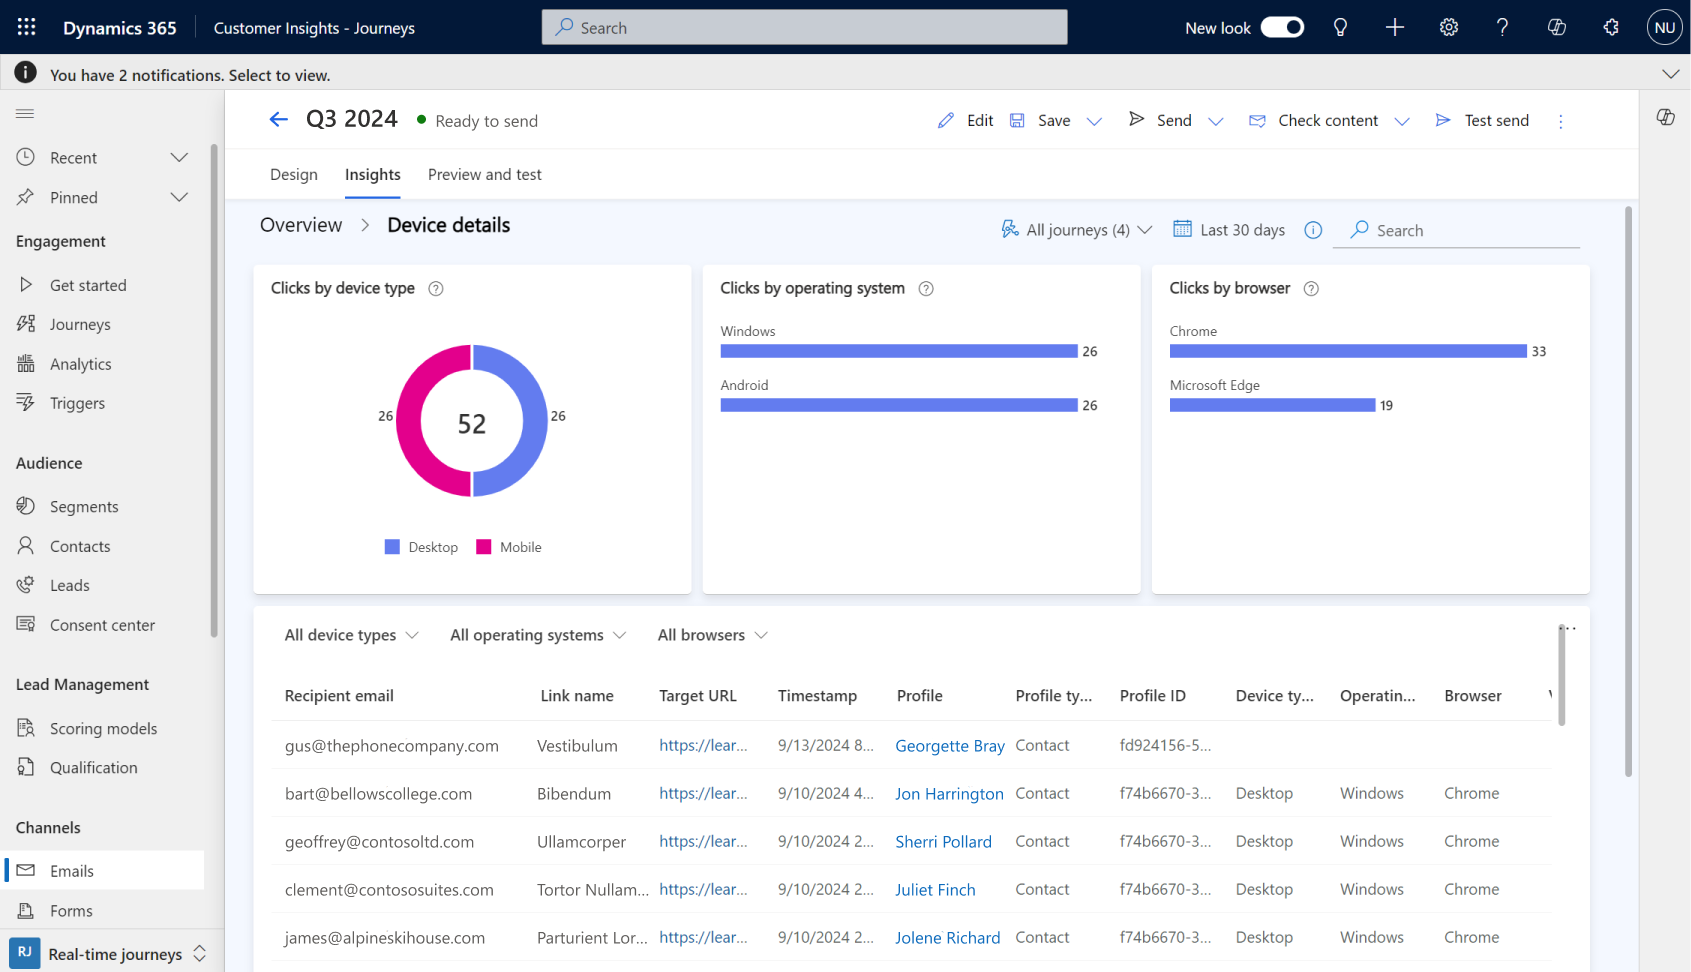
Learn about the different device types, email clients, operating systems, and browsers your customers use to read your emails. Design your emails to match the devices and user agents your audience uses most, and make sure your messages are easy to read.
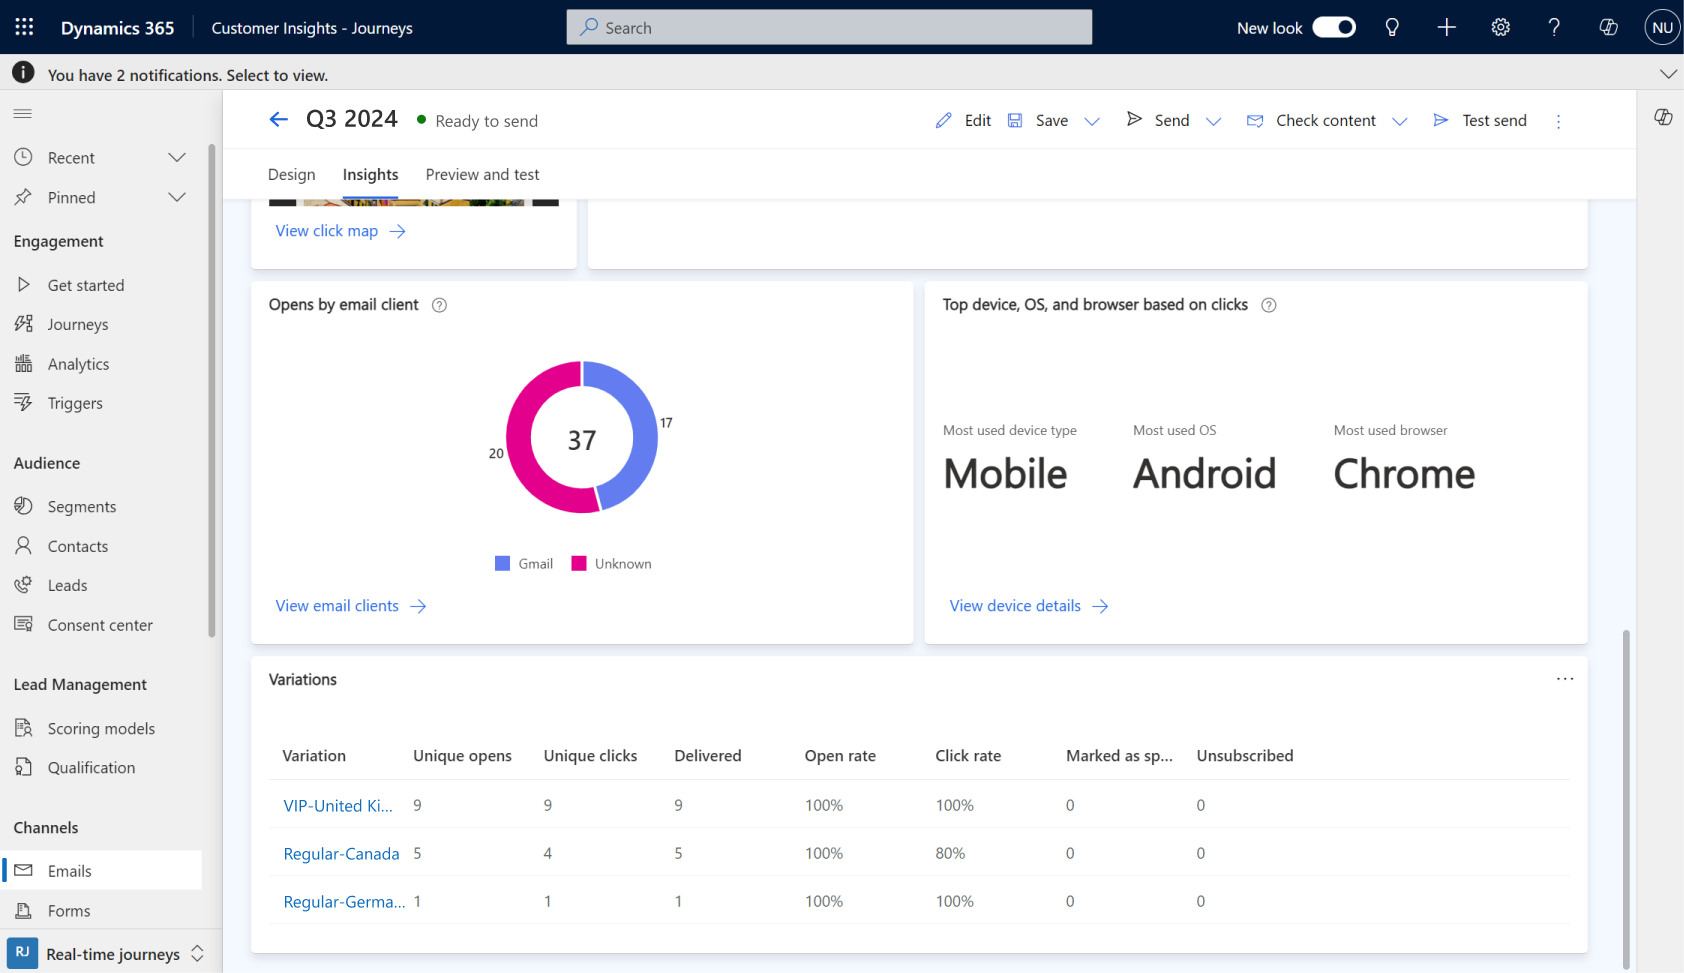
- Email clients by opens: Detection of email clients relies on email opens and depends on the response from the email provider. Some email clients, like Apple Mail, have privacy protections that can prevent detection.
- Browsers, operating systems, and device types by clicks: Detection of device types, browsers, and operating systems depends on email clicks. You can't detect all email clients, device types, browsers, and operating systems.
User agents are labeled as:
- "Unknown" when the agent can't be detected.
- "Other" when the agent can be detected but isn't categorized yet, like a local provider.
Note
- Data related to user agents can be partial or missing depending on when your journey runs, especially if it was active before August 2024.
- If you're building custom reports, learn more about the list of Globally Unique Identifiers (GUIDs) as they appear in real-time marketing storage (accessible using Microsoft Fabric) to map data on email clients, device types, browsers, and operating systems: Map GUIDs to email clients, browsers, operating systems, and device types
Link insights
Get valuable insights into your email's URL engagement and make data-driven decisions to improve your email marketing campaigns with link insights. With link insights, you see how each link in your email campaign performs and identify the top-performing links by total clicks, unique clicks, and click rate. Group your links by URL or link alias for more clarity. Learn more: Edit email components in a live journey
Note
- The click map feature is dependant on link insights.
- Link insights are only supported for emails and journeys created after September 2024. However, even if both your journey and the email you're analyzing were created after that date, link insights aren't generated if the journey includes any older emails (created before September 2024). This is because the presence of legacy emails causes the system to treat the entire journey as legacy, which disables link tracking and heatmap functionality, even for the newer emails.
Click map
Click map is a fast, visual way to understand customer engagement based on your email design. At a glance, the heatmap colors and link ranking show the most interacted areas. You can show or hide the heatmap for better visualization.
- Get deeper insights into which links get the most and least engagement by filtering the list of links based on click-through, total clicks, and unique clicks.
- Switch between all devices, desktop, or mobile (including other device types), to see interaction insights for each device type. You can view insights for all devices together only if the email sections are identical across all devices. If there are any differences, like adding or removing a section on mobile or desktop, the "all devices" view isn't available.
- Select a link in the list to see its ___location on the email design, or hover over your links on the design to show the interaction data. Links with zero interactions aren't included in the list; you only see them by hovering over the email design.
- The heatmap supports email variations. Compare the performance of different email variations and find which elements resonate most with your audience. Select and search for a variation using the dropdown. To compare several variations, open them in a different tab and compare them by splitting the screen.
- For reporting purposes, you can zoom in on specific parts of your email or zoom out to take a screenshot of the full click map and download an Excel list of the click insights.
Use click map insights to optimize your content placement, layout, and design to boost customer engagement.
Note
- The click map only shows the interactions and design for the latest email version.
- To show the click map feature, the journey must be created after the feature release in October 2024.
- When you add older emails to your journey, to start showing the click map, use live editing and update the email. The links in your email are updated and tracked for new interactions.
- The click map might have incomplete data or miss some data depending on when your journey and email content was created and running, especially if it was active before October 2024.
Variation insights (conditional content)
Get insights into key metrics like unique opens, unique clicks, delivered messages, open rate, click rate, spam messages, and unsubscriptions for each variant. Use these insights to see what resonates with your audience. You see variation insights only if an email has conditional content.


