Note
Access to this page requires authorization. You can try signing in or changing directories.
Access to this page requires authorization. You can try changing directories.
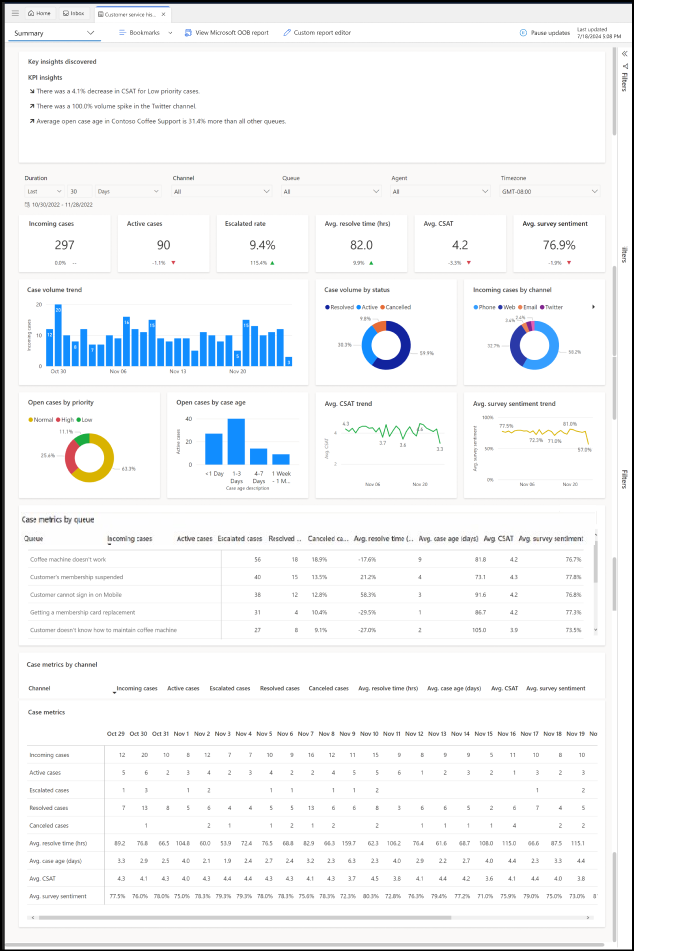
The Summary dashboard gives you a broad overview of the customer service experience in your organization. Learn how to access the dashboard.
The summary dashboard includes various charts with graphical views of key performance indicators (KPIs) in Customer Service.
The case volume drivers and emerging case volume by topic charts use natural language understanding to group support cases as topics that are a collection of related cases. These charts show you the customer support topics generate the most volume and emerging topics with the highest rate of change in volume. This data helps you identify areas of improvement that can affect support performance.
By default, the dashboard shows you KPIs for the past month and for all channels, queues, and customer service representatives (service representatives or representatives) in your system. The data filtering options allow you to select data for a specific time period, channel, queue, and representative. To filter data by duration, channel, queue, or representative, select a value from the respective dropdown list.
Note
If you switch to a different dashboard, the filter you specify persists and is applied to the data on all dashboards.
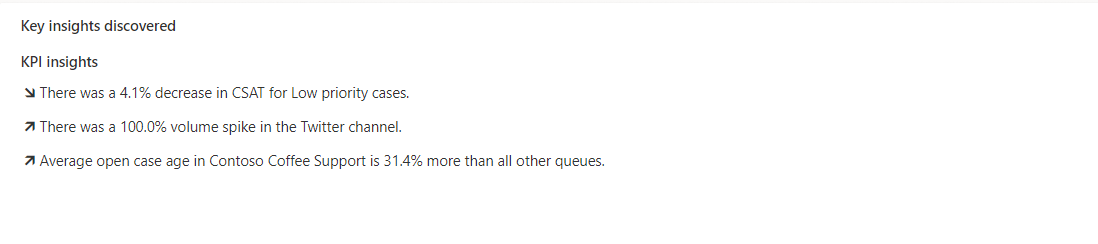
Key Insights discovered
The Key Insights discovered section has two areas:
- KPI insights: Important subjects that impact performance, such as CSAT pertaining to priority, volume pertaining to channel, and open cases pertaining to queues.
Report details
The KPI summary charts summarize the KPIs for the specified time period and the percent change over the period. You can filter these areas by duration, channel, queue, and representative.
The case lifecycle and the metrics that can be derived in the different statuses is represented in the following diagram.

The following table shows the KPIs that appear in the report.
| KPI | Description |
|---|---|
| Incoming cases | The number of cases created to support customers. |
| Active cases | The number of cases that are currently open. |
| Escalated rate | The percentage of cases that have been escalated. |
| Avg. resolve time (hrs) | The average length of time taken by a representative to resolve the case. |
| Avg. CSAT | The average customer satisfaction score, based on Customer Voice survey submitted by the customer. |
| Avg. survey sentiment | The average sentiment score, based on Customer Voice survey written feedback submitted by the customer. |

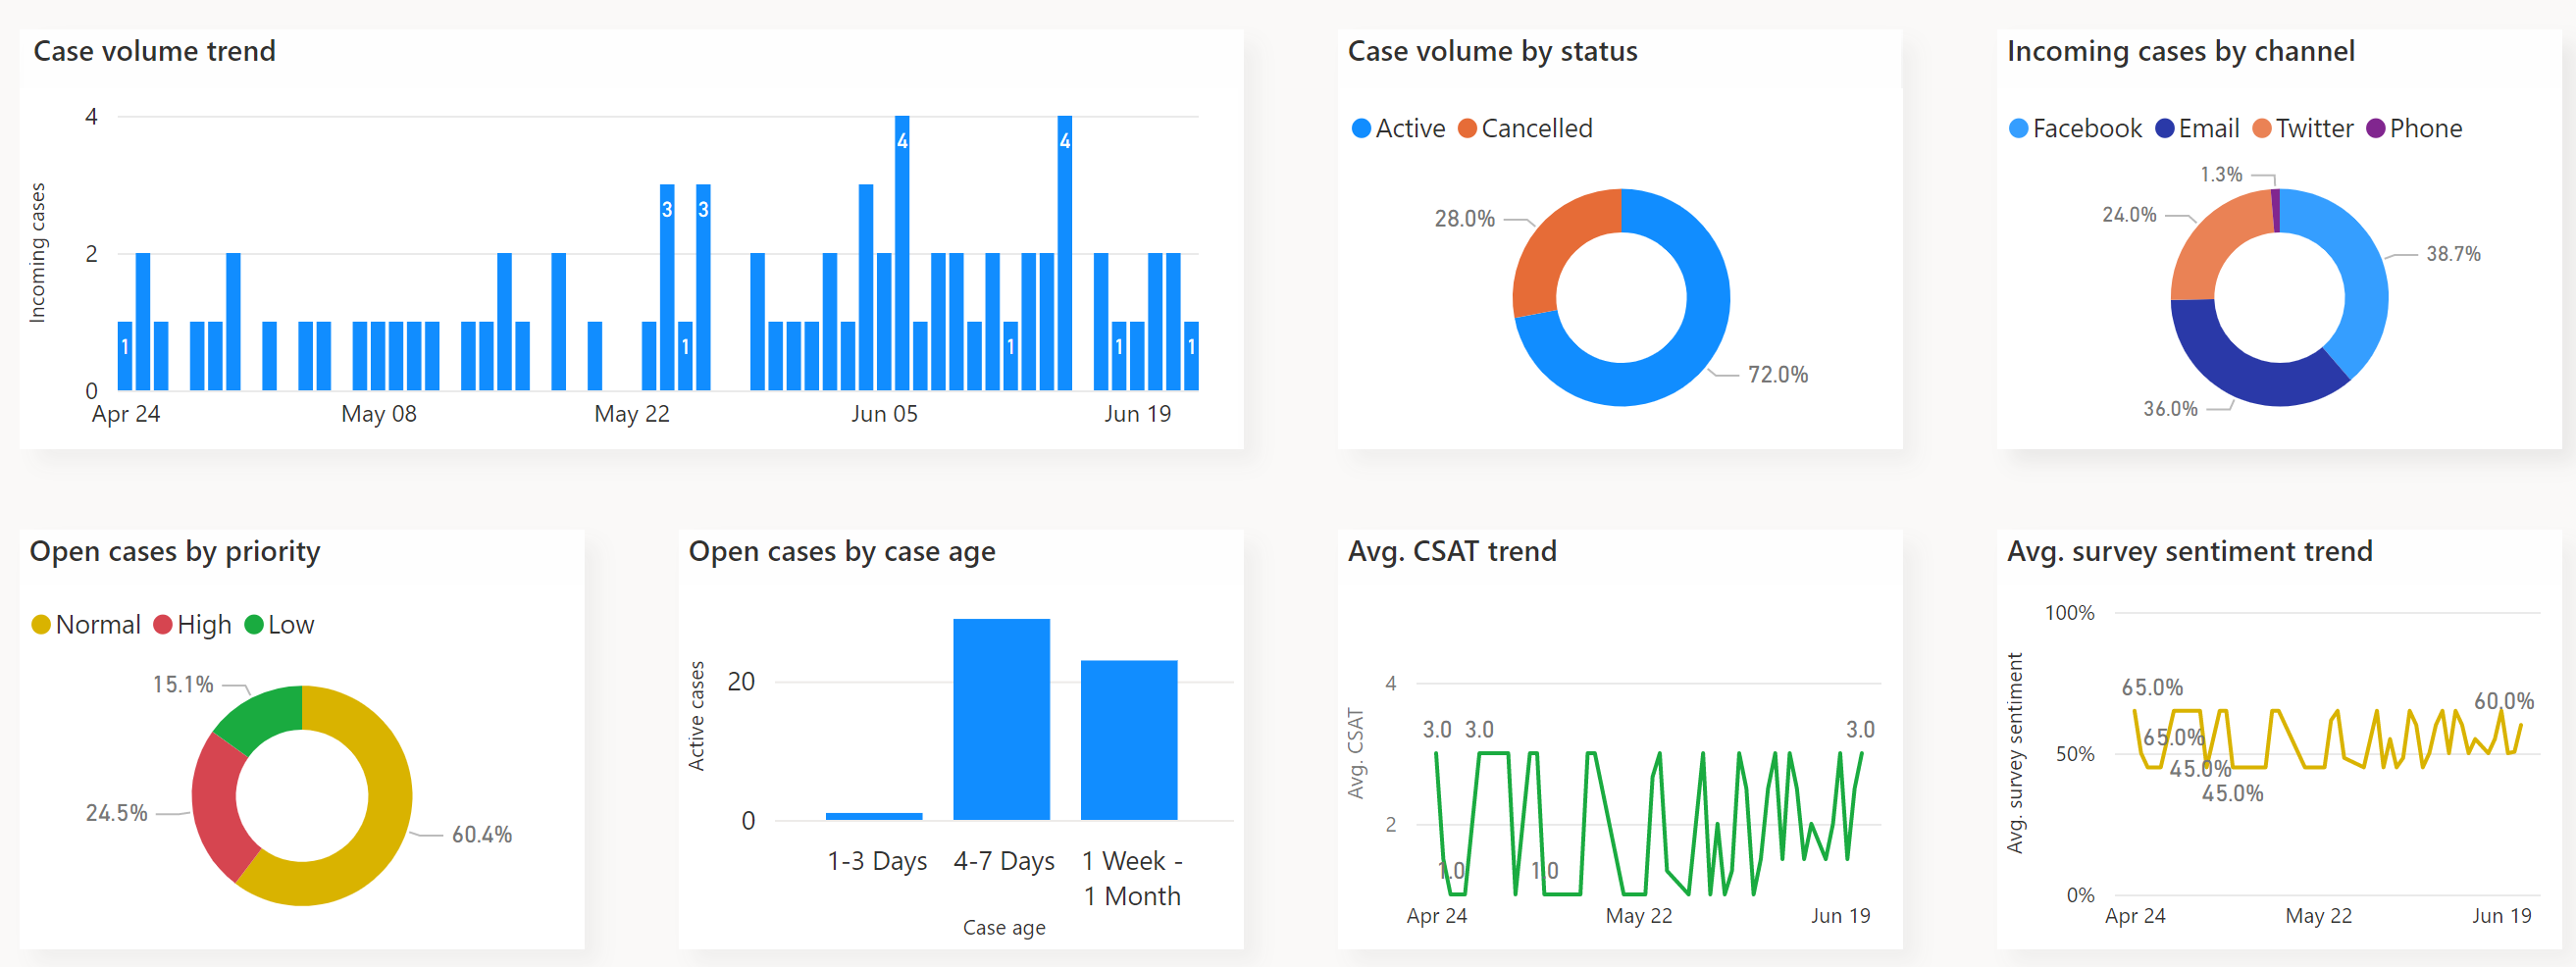
The following metrics appear in the charts.
| Chart | Description |
|---|---|
| Case volume by status | A breakdown of case volume by status. |
| Open cases by priority | A case breakdown by priority level. |
| Incoming cases by channel | A case breakdown by channel. |
| Open cases by case age | A breakdown of cases by the amount of time in an open state. |
| Avg. CSAT trend | The year-over-year trend of case volume. |
| Avg. survey sentiment trend | The year-over-year trend of CSAT from Customer Voice survey responses. |
You can view the core case metrics by channel or core case metrics in relation to other metrics and date.

Related information
Dashboard overview
Customer Service Representative dashboard
Manage report bookmarks