Note
Access to this page requires authorization. You can try signing in or changing directories.
Access to this page requires authorization. You can try changing directories.
Important
Some of the functionality described in this release plan has not been released. Delivery timelines may change and projected functionality may not be released (see Microsoft policy). Learn more: What's new and planned
| Enabled for | Public preview | General availability |
|---|---|---|
| Users, automatically | - | Jun 2025 |
Business value
The improvements in reporting and analytics for the sales area will help your business track new KPIs and scenarios in Power BI. New enhanced possibilities in data analysis allow you to create mini reports. Customizable Excel layouts for many finance reports allow you to tailor them to your needs, while enriched datasets provide more comprehensive analysis.
Feature details
We've significantly improved reporting and analytics for sales.
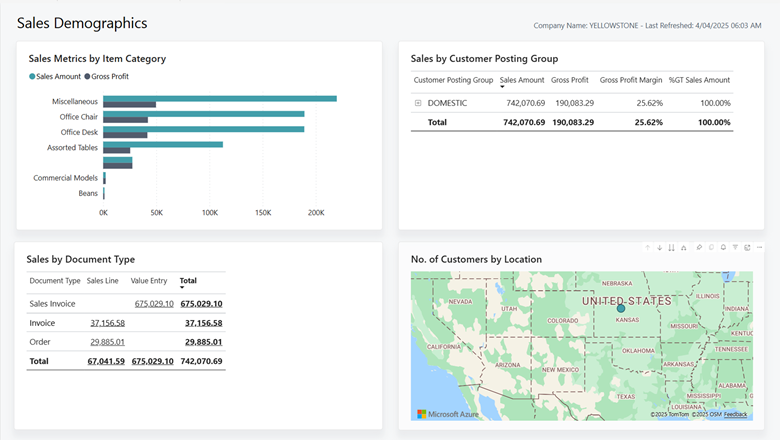
For the Power BI app for Sales, we added new reports and expanded the capabilities of some that were already available. The following new reports give you additional insights into your sales processes:
- Sales Demographics
- Sales Decomposition (with AI-driven insights)
- Key Sales Influencers (with AI-driven insights)
- Opportunity Overview
- Sales Quote Overview
- Return Order Overview
For existing analyses, we updated the following reports with ways to dig deeper into your sales data:
- The Month-To-Date report filters data to the current month.
- The Sales by Item report includes new Ribbon Chart for Sales by Item Category Over Time and new Scatter Chart for Profitability by Item Category charts.
- The Sales by Customer Page includes a new Azure map visual for Sales Amount by Location, a Customer Bar Chart with Gross Profit Pareto Analysis by Customer, and an updated Sales by Customer Details visual to include Pareto Cumulative Gross Profit fields.
- The Sales by Salesperson report now includes new Estimated Opportunity Value and Scatter Chart for Profitability by Salesperson pie charts.
- The Sales by Location report includes a new Azure Map for Sales Amount by Customer Location.
To support on-the-fly analyses, the new Sales Order Analysis Query makes ad-hoc analysis of sales orders easy with analysis mode. The following list pages have more fields to make data analysis easier:
- Sales Orders
- Sales Return Shipments
- Sales Credit Memos
Also, the Aged Accounts Receivables Excel report is now generally available.


