Note
Access to this page requires authorization. You can try signing in or changing directories.
Access to this page requires authorization. You can try changing directories.
| Enabled for | Public preview | General availability |
|---|---|---|
| Users, automatically | - |  Jun 1, 2025
 |
Business value
The improvements in reporting and analytics for Sustainability help your business track new KPIs and scenarios in Power BI. Comprehensive documentation and teaching tips help you fully leverage these new features.
Feature details
We've significantly improved reporting and analytics for our Sustainability features. In addition to the three existing reports with the Excel layout, there are new tools for Power BI and data analysis.
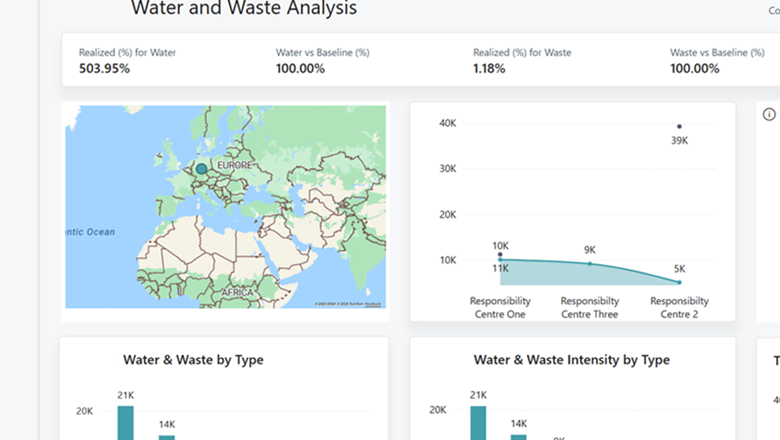
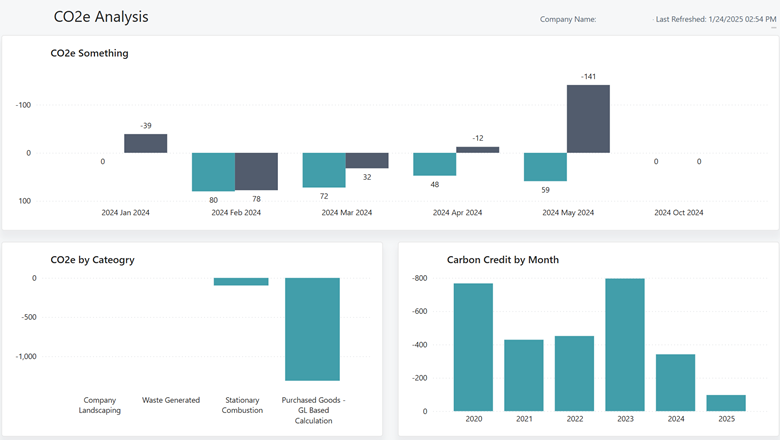
- You can track new KPIs and scenarios in the updated Power BI Sustainability app, such as emissions by category and scope, CO2e analysis, journey to net-zero carbon, realized vs. baseline vs. target, water and waste analysis, and so on.
- You can track new KPIs and scenarios related to social and governance, such as gender or age distribution, qualifications, and so on.
- All reports have teaching tips and are documented.
- You can learn more by going to the new Sustainability analytics section in the documentation.


Tell us what you think
Help us improve Dynamics 365 Business Central by discussing ideas, providing suggestions, and giving feedback. Use the forum at https://aka.ms/bcideas.