Note
Access to this page requires authorization. You can try signing in or changing directories.
Access to this page requires authorization. You can try changing directories.
With Microsoft Fabric, you can use Apache Spark to run notebooks, jobs, and other kinds of applications in your workspace. This article explains how to monitor your Apache Spark application.
You can access the Spark monitoring detail page from either the Fabric Monitoring Hub or the item's Recent runs panel.
To open an Apache Spark application job from the recent runs panel:
- From the Spark job definition or notebook item context menu, select Recent run.
- In the Recent runs page, select a job to open its monitoring details.
Jobs tab
The Jobs tab displays the list of job runs for the selected Spark application. You can view details such as Job ID, Description, Status, Stages, Tasks, Duration, Processed data, Data read, Data written, and Code snippet.
- Click the Job ID to expand or collapse details of a job.
- Click the Job description to navigate directly to the job or stage page in the Spark UI.
- Click the Code snippet to view and copy the code related to that job.
- Use the Filter icon (upper-right corner) to filter jobs by Notebook when running in a high-concurrency Spark session.
Resources tab
The Resources tab shows the executor usage graph, which visualizes the allocation and utilization of Spark executors in near real-time during Spark execution. For more details, see Monitor Apache Spark Applications Resource Utilization.
Summary panel
In the application monitoring page, click the Properties icon in the top-right corner to open or collapse the summary panel. Here, you can view application details, including:
Logs tab
The Logs tab provides access to full logs for Livy, Prelaunch, and Driver processes.
- Use the left panel to select the type of logs you want to view.
- Search by keyword or filter logs by status, Notebook, or Lakehouse (for high-concurrency sessions).
- Click Download log to save logs locally.
Note
Logs may not be available if the job is queued or if cluster creation fails.
Data tab
The Data tab allows you to copy or download input/output file information and view file properties.
- Expand or collapse the left panel to navigate.
- View details such as file name, format, size, source, and path.
- Download files, copy paths, or view properties directly.
Item snapshots tab
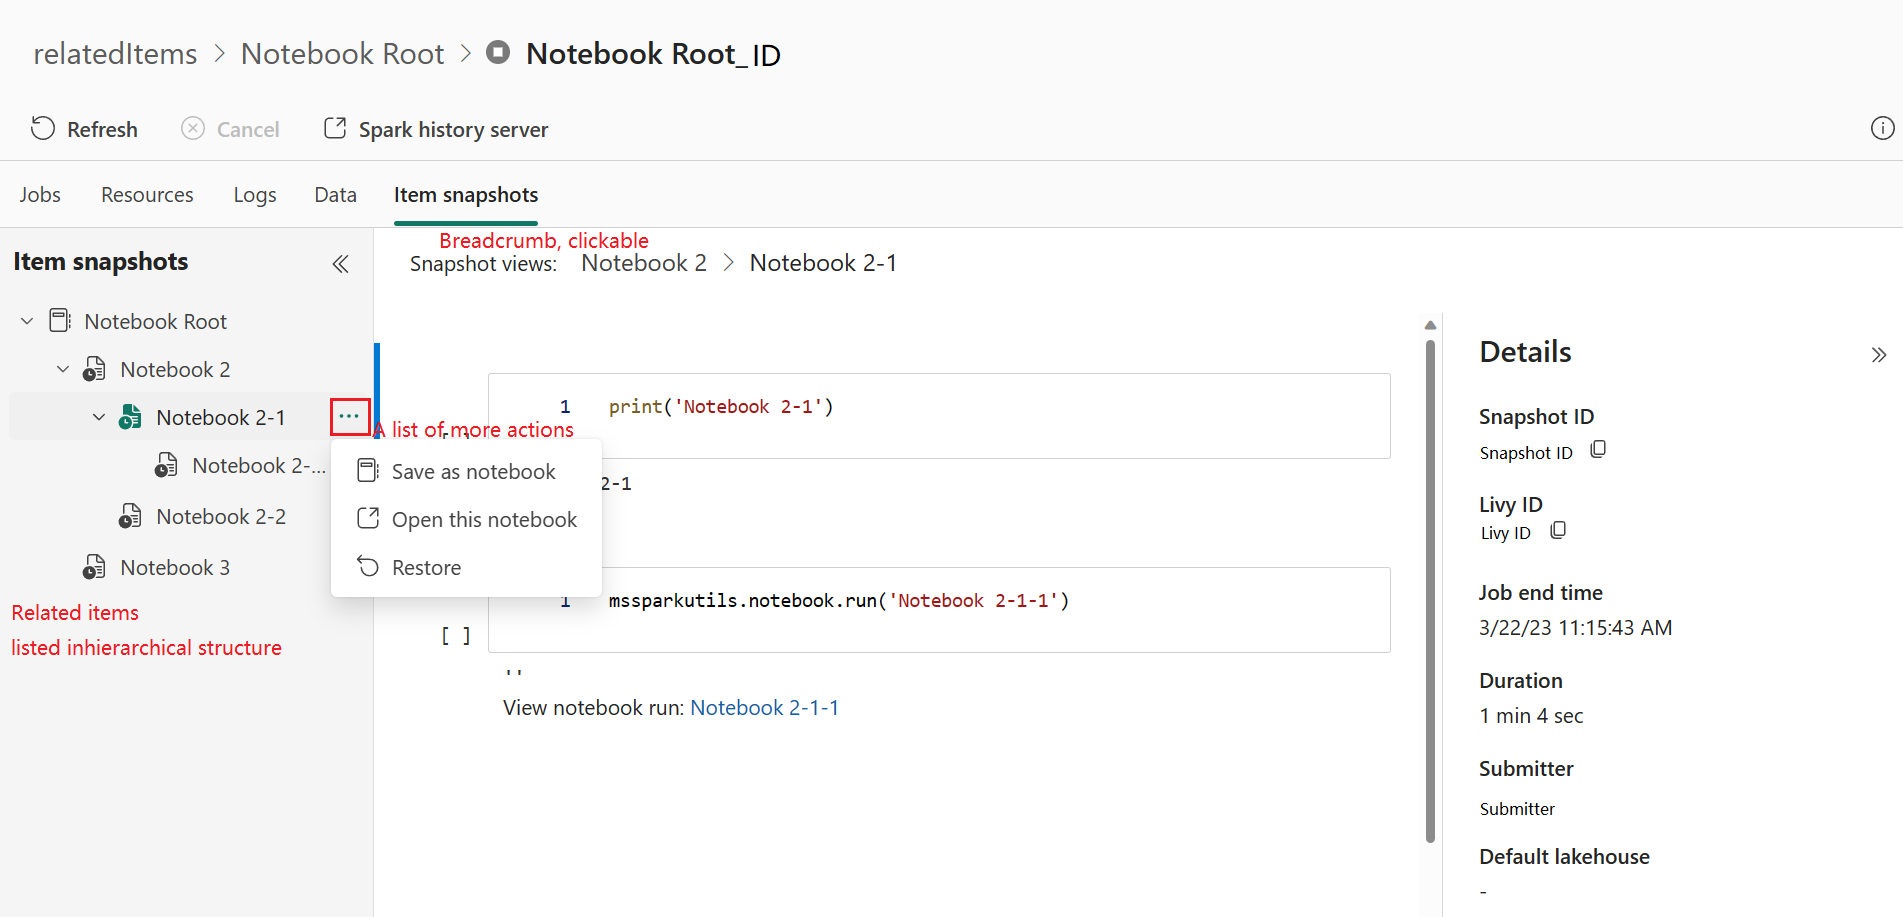
The Item snapshots tab lets you browse items associated with the Spark application, including Notebooks, Spark job definitions, and Pipelines.
Snapshots include:
- Notebook code and parameter values at execution time.
- Spark job definition settings and parameters at submission time.
The Item snapshots tab allows you to browse and view items associated with the Apache Spark application, including Notebooks, Spark job definition, and/or Pipelines. The item snapshots page displays the snapshot of the code and parameter values at the time of execution for Notebooks. It also shows the snapshot of all settings and parameters at the time of submission for Spark job definitions. If the Apache Spark application is triggered by a pipeline, the related item tab also presents the corresponding pipeline and the Spark activity.
From the Item snapshots page, you can:
- Browse related items in a hierarchical tree.
- Use the More actions (...) menu for each item.
- Click a snapshot item to view its contents.
- Use breadcrumbs to trace navigation from the selected item to the root.
Diagnostics panel
The Diagnostics panel provides real-time recommendations and error analysis generated by Spark Advisor. With built-in patterns, Spark Advisor helps you avoid common mistakes, analyze failures, and identify their root causes.
Related content
After viewing details of an Apache Spark application, you can also monitor Spark job progress directly beneath the Notebook cell. For more, see:


