Note
Access to this page requires authorization. You can try signing in or changing directories.
Access to this page requires authorization. You can try changing directories.
This guide walks you through ways to check in on your pipeline runs, or monitor your pipeline runs. Whether you're just curious about how things are going or need to troubleshoot something specific, we’ll show you how to track progress, spot issues early, and make sure everything’s running smoothly. Monitoring helps you stay in control so that you can catch problems before they grow and keep your workflows on track.
Monitor pipeline runs
To monitor your pipeline runs, hover over your pipeline in your workspace. Doing so brings up three dots to the right of your pipeline name.
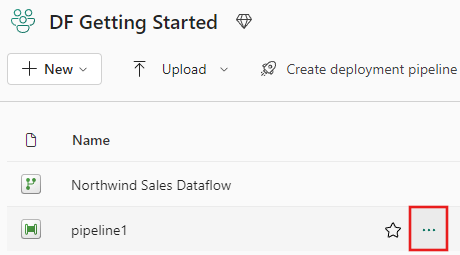
Select the three dots to find a list of options. Then select View run history. This action opens a fly-out on the right side of your screen with all your recent runs and run statuses.

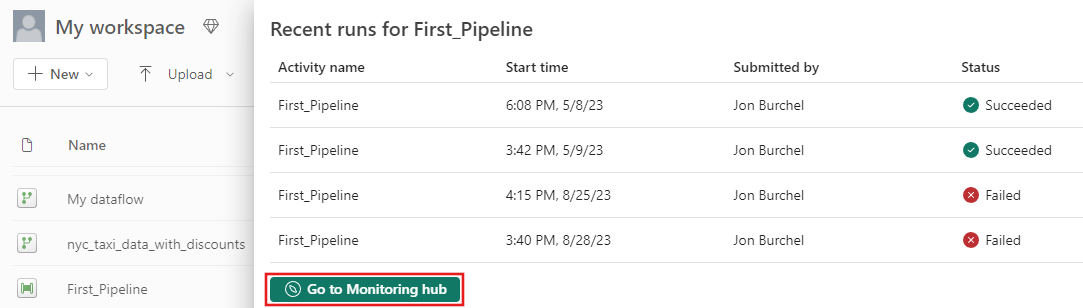
Select Go to monitoring hub from the prior screenshot to view more details and filter results. Use the filter to find specific pipeline runs based on several criteria.

Select one of your pipeline runs to view detailed information. You're able to view what your pipeline looks like and view more properties like Run ID or errors if your pipeline run failed.

If you have greater than 2000 activity runs in your pipelines, select Load more to see more results in the same monitoring page.
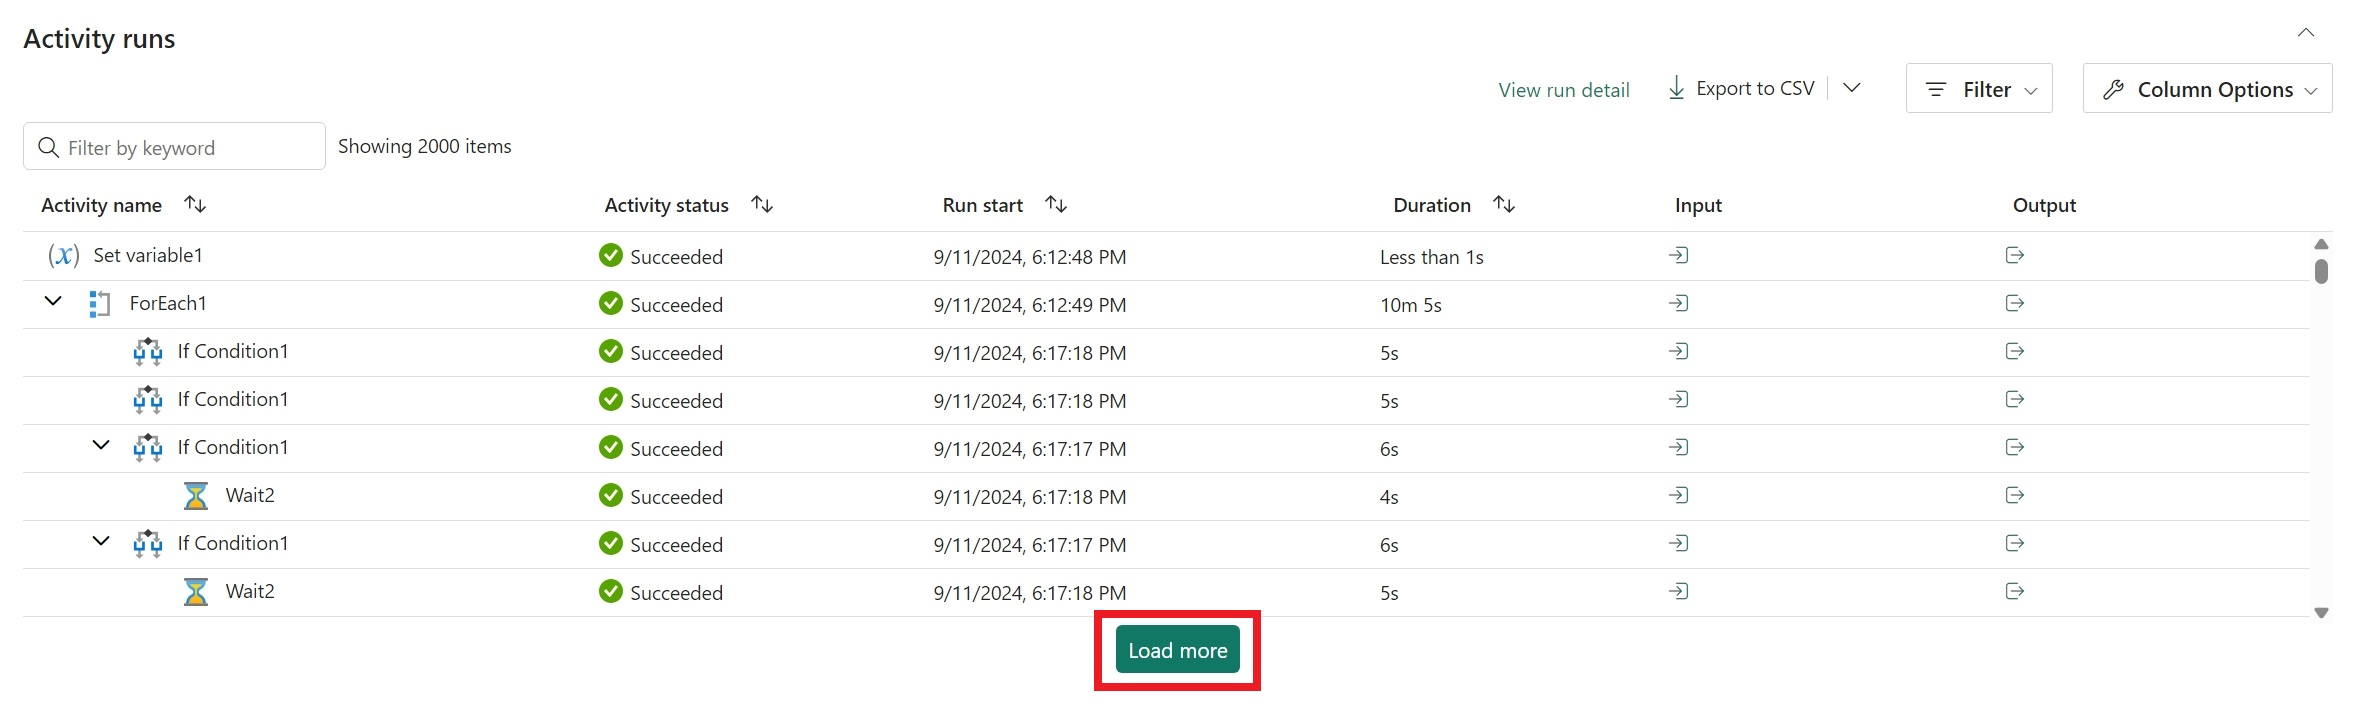

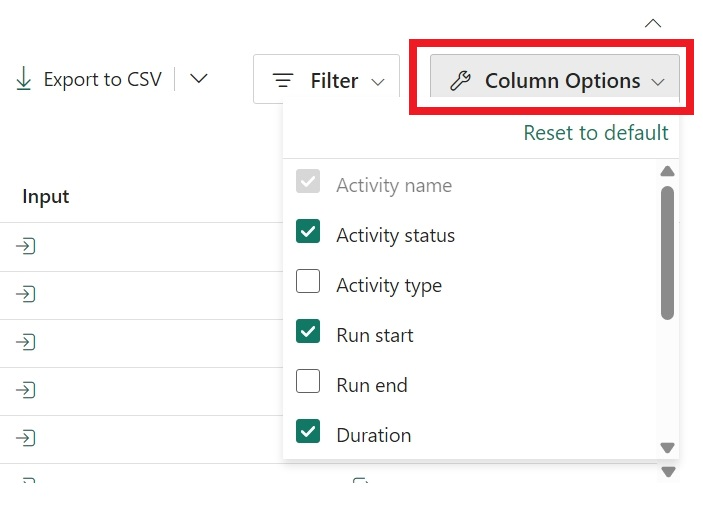
Use the Filter to filter by activity status or Column Options to edit the columns viewed in the monitoring view.

You can also search for an activity name, activity type, or activity run ID with the Filter by keyword box.


If you want to export your monitoring data, select Export to CSV.

To find additional information on your pipeline runs Input and Output, select the input or output links to the right of the relevant row in the Activity Runs.
You can select Update pipeline to make changes to your pipeline from this screen. This selection takes you back to the pipeline canvas.
You can also Rerun your pipeline. You can choose to rerun the entire pipeline or only rerun the pipeline from the failed activity.
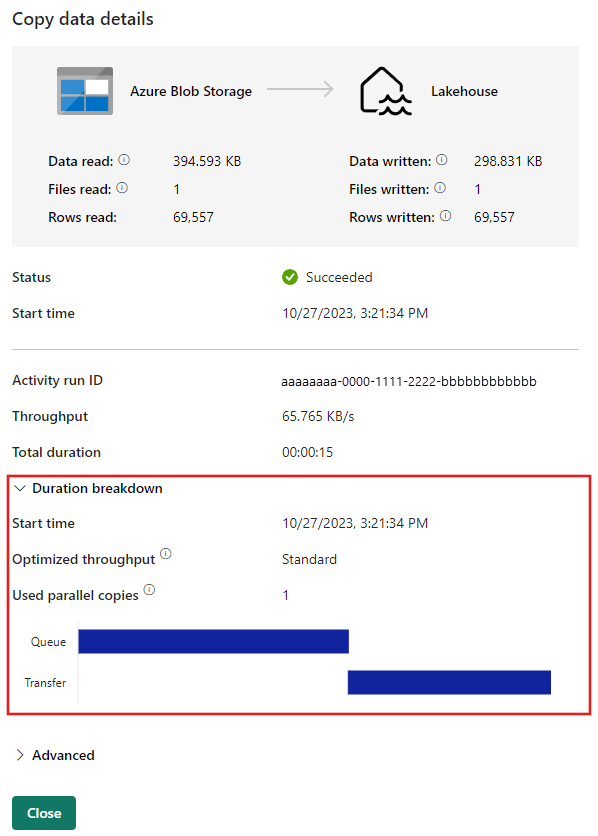
To view performance details, select an activity from the list of Activity Runs. Performance details pop up.
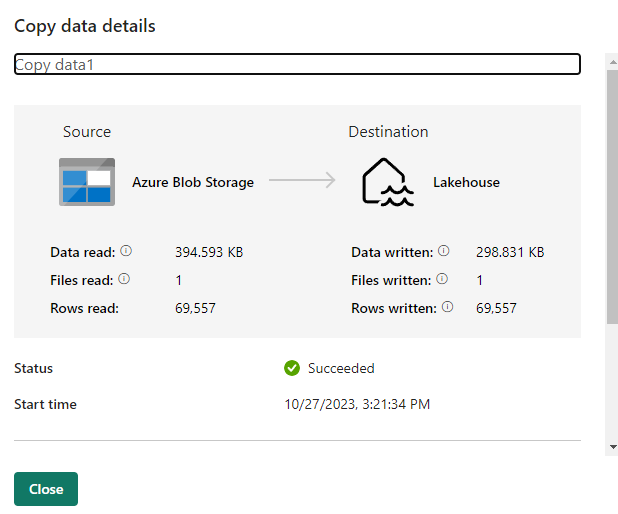
More details can be found under Duration breakdown and Advanced.
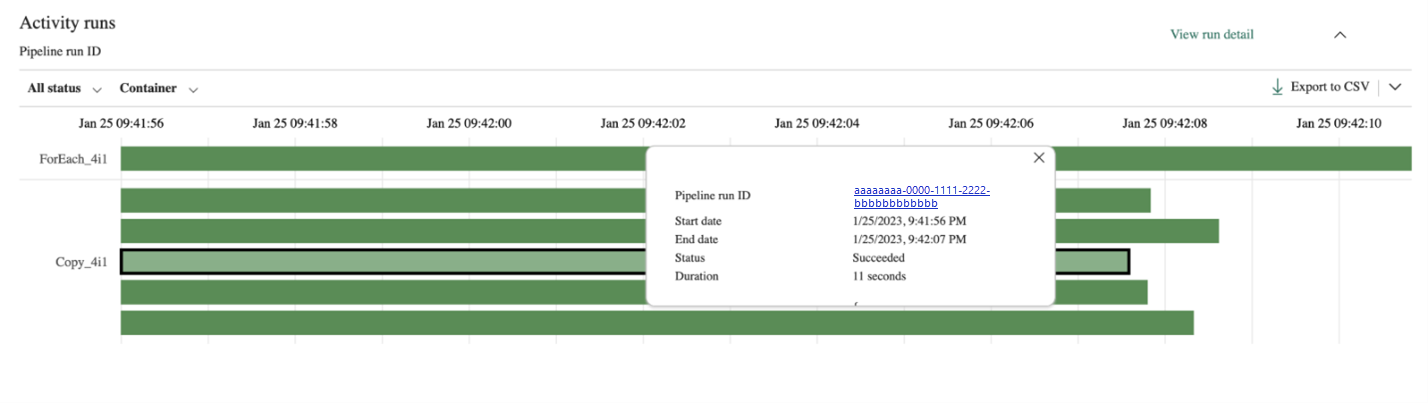
Gantt view
Switching to the Gantt view gives you a clear, visual way to track your pipeline runs over time. Each run shows up as a bar, grouped by pipeline name, and the length of the bar shows how long the run took. It’s a great way to spot patterns, compare durations, and quickly see what’s running when. This view makes monitoring easier so that you can catch delays, overlaps, or anything unusual at a glance.

The length of the bar relates to the duration of the pipeline. You can select the bar to view more details.

Workspace monitoring for pipelines
Workspace Monitoring provides log-level visibility for all items in a workspace, including pipelines.
To enable Workspace Monitoring, go to Workspace Settings in your Fabric Workspace and select Monitoring.
Add a Monitoring Eventhouse and turning on Log workspace activity. Fabric creates a KQL database inside the Eventhouse within your workspace for storing logs.

Navigate to the KQL database created. You can find this in the Monitoring database link within the Monitoring settings or find the database within your workspace.
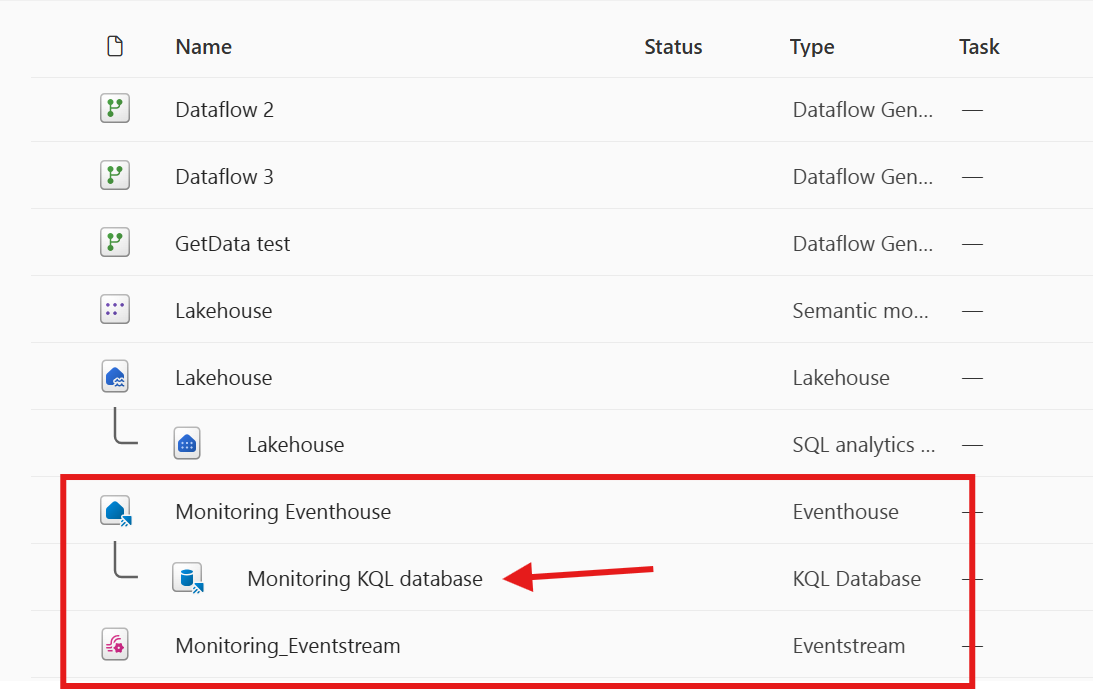
Within the KQL database, the ItemJobEventLogs table captures pipeline-level events that occur in your workspace (we call this L1 monitoring). Logs include pipeline name, run status, timestamps, and system diagnostics.

Use KQL queries in the Monitoring Eventhouse to analyze:
- Success/failure trends
- Performance metrics
- Error details for troubleshooting