Note
Access to this page requires authorization. You can try signing in or changing directories.
Access to this page requires authorization. You can try changing directories.
Map is a powerful geospatial visualization platform that transforms spatial data, whether static or real-time, into actionable intelligence. By uncovering patterns, relationships, and trends across space and time, Map reveals insights often missed in traditional charts and tables, helping you make informed decisions with greater clarity.
Map offers robust customization capabilities that let you tailor visualizations to your audience and data content. Overlay diverse data layers—such as bubbles, heatmaps, lines, polygons, and 3D extrusions—to represent complex spatial relationships. Each layer supports advanced styling options including color schemes, opacity, stroke width, and interactive tooltips. To enhance clarity and emphasize key insights, choose from multiple map styles like Grayscale, Road, Satellite, or Night.
Prerequisites
- A workspace with a Microsoft Fabric-enabled capacity. For more information on creating a workspace, see Create a workspace
Enable tenant settings in the admin portal
Important
Only the tenant admin is authorized to perform this step.
- Go to the admin portal.
- Select the Tenant settings tab in the admin portal and search for Map. For more information, see About tenant settings.
- Toggle the button for Users can create Maps (preview) to Enabled then select Apply. For more information, see Tenant settings.

- If your Fabric capacity is located outside the EU or US regions, you must enable the Azure Maps services tenant settings. Begin by searching for Azure Maps services in the tenant settings, then toggle the option Data sent to Azure Maps can be processed outside your capacity's geography region, compliance boundary, or national cloud instance to Enabled.
- Select Apply

For more information, see Azure Maps service tenant settings – Microsoft Fabric.

New map
Maps exist within the context of a workspace, and every map is associated with the workspace it was created in.
To create a new map:
- Select the desired workspace.
- Select + New item.
- In the New item window, select Map (preview).

- On the New Map popup, enter a name for the map. Configure workspace you want to save to and select Create.

- A new map is created in your workspace.


Visualize spatial data
You can start visualizing spatial data on the map canvas by connecting to supported data sources. Map currently supports connections to Lakehouses and Eventhouses. Refer to the following sections for instructions on establishing these connections, along with details about supported data formats and item types in Microsoft Fabric.
Connect to lakehouses
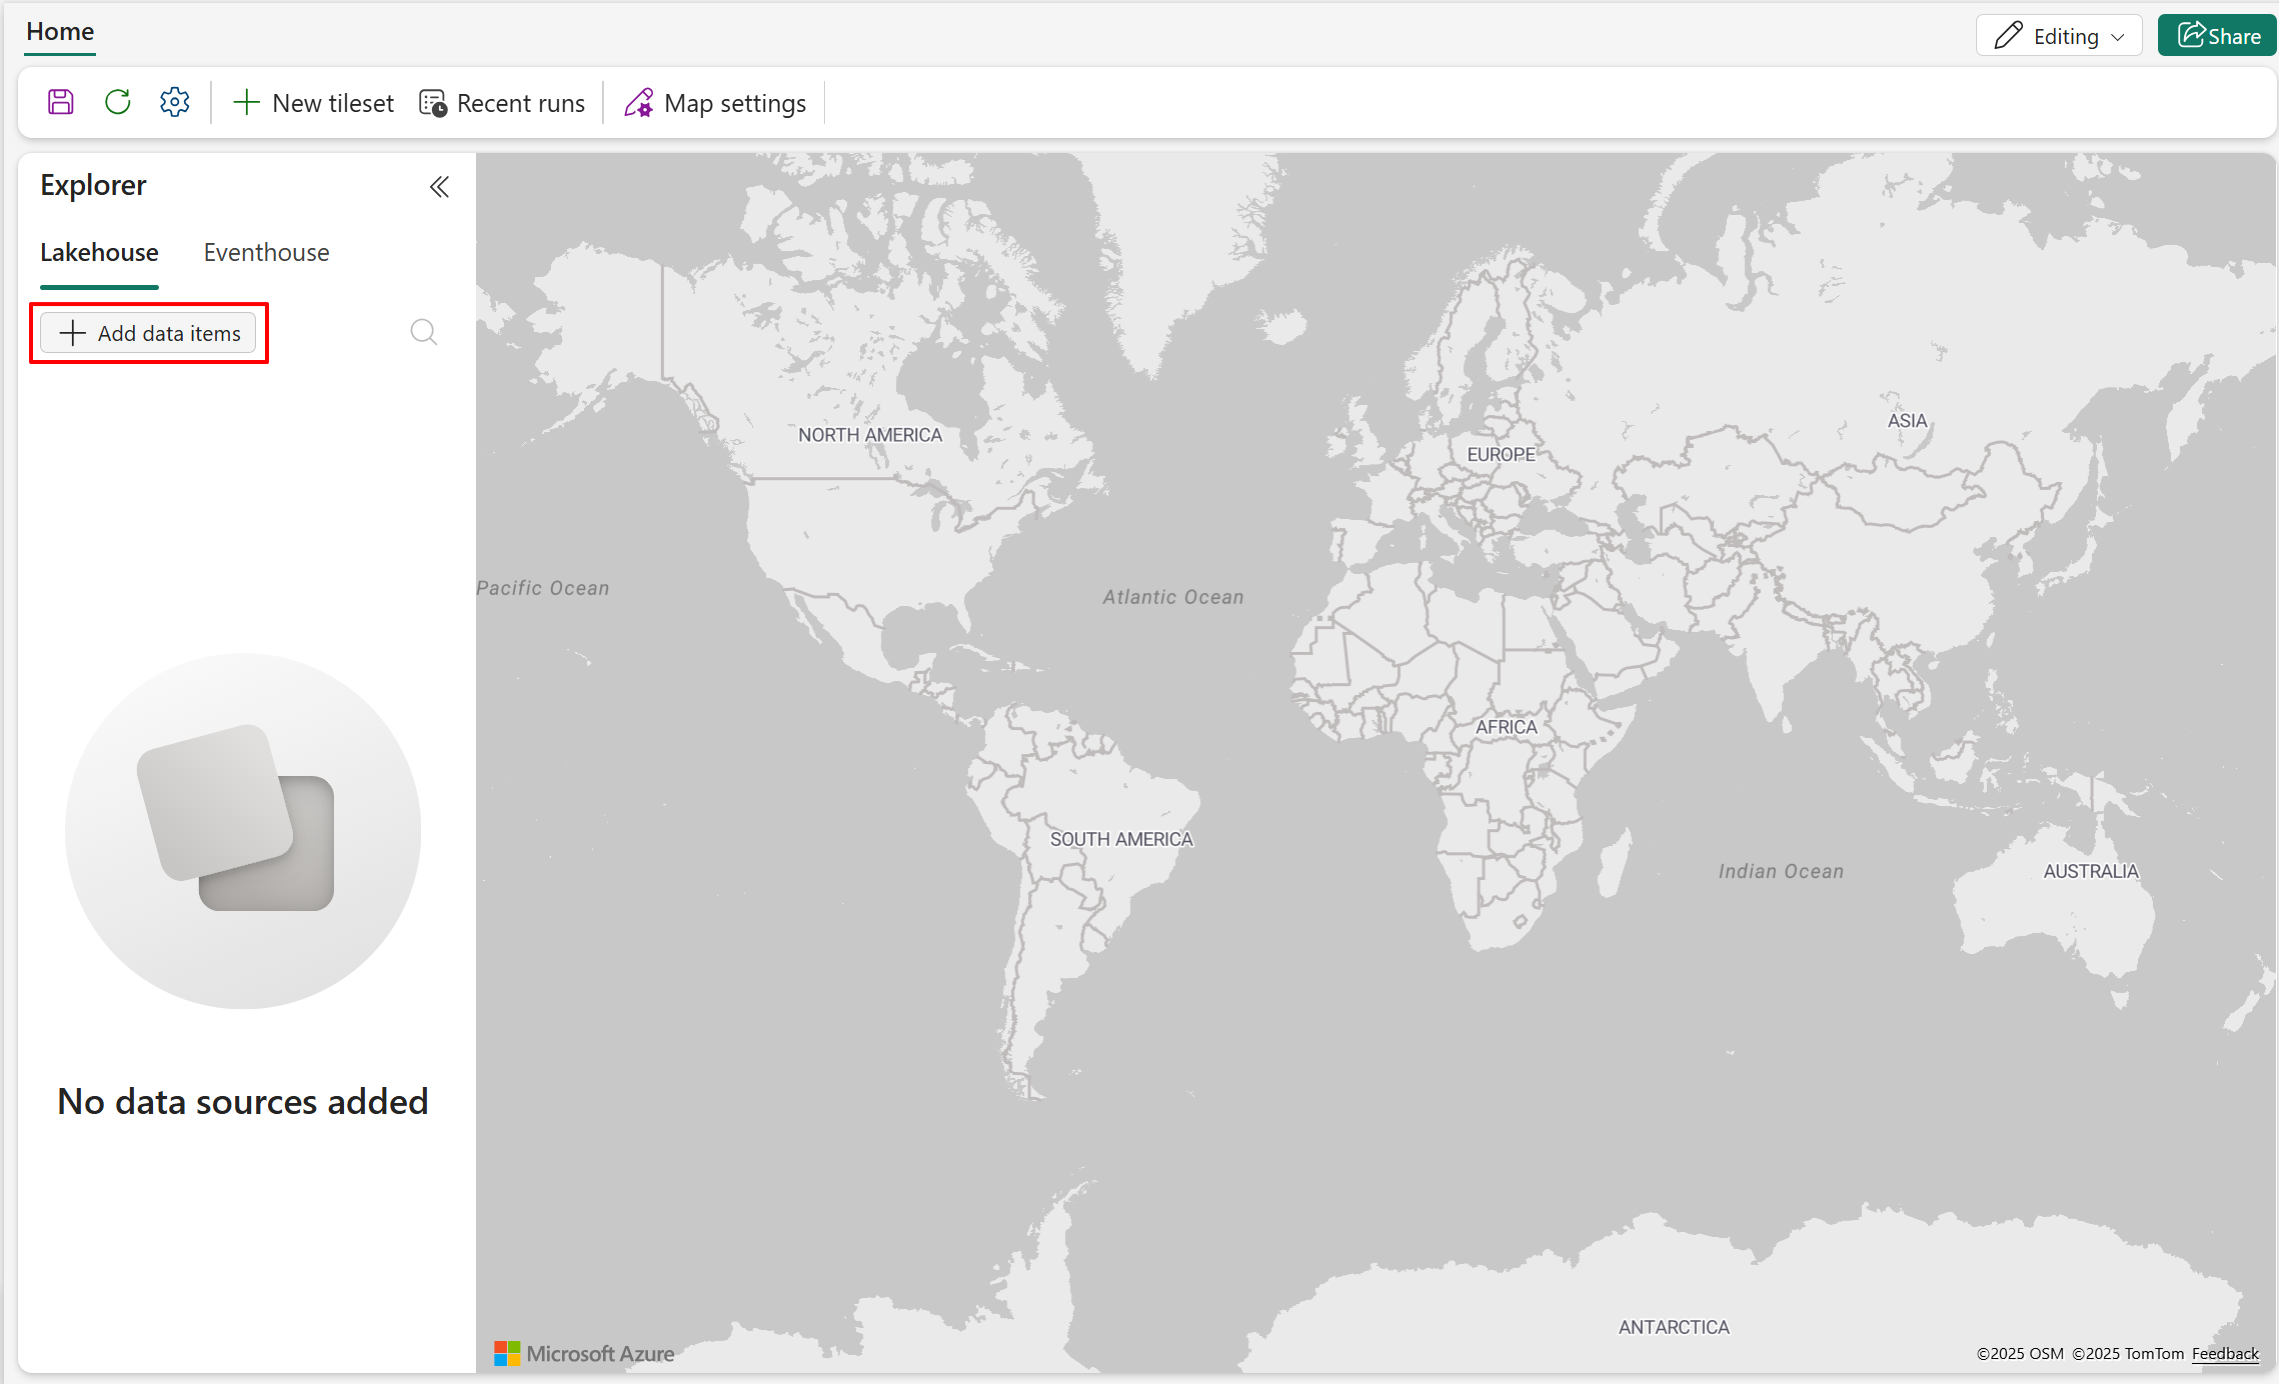
- Select Add data items to open OneLake catalog.
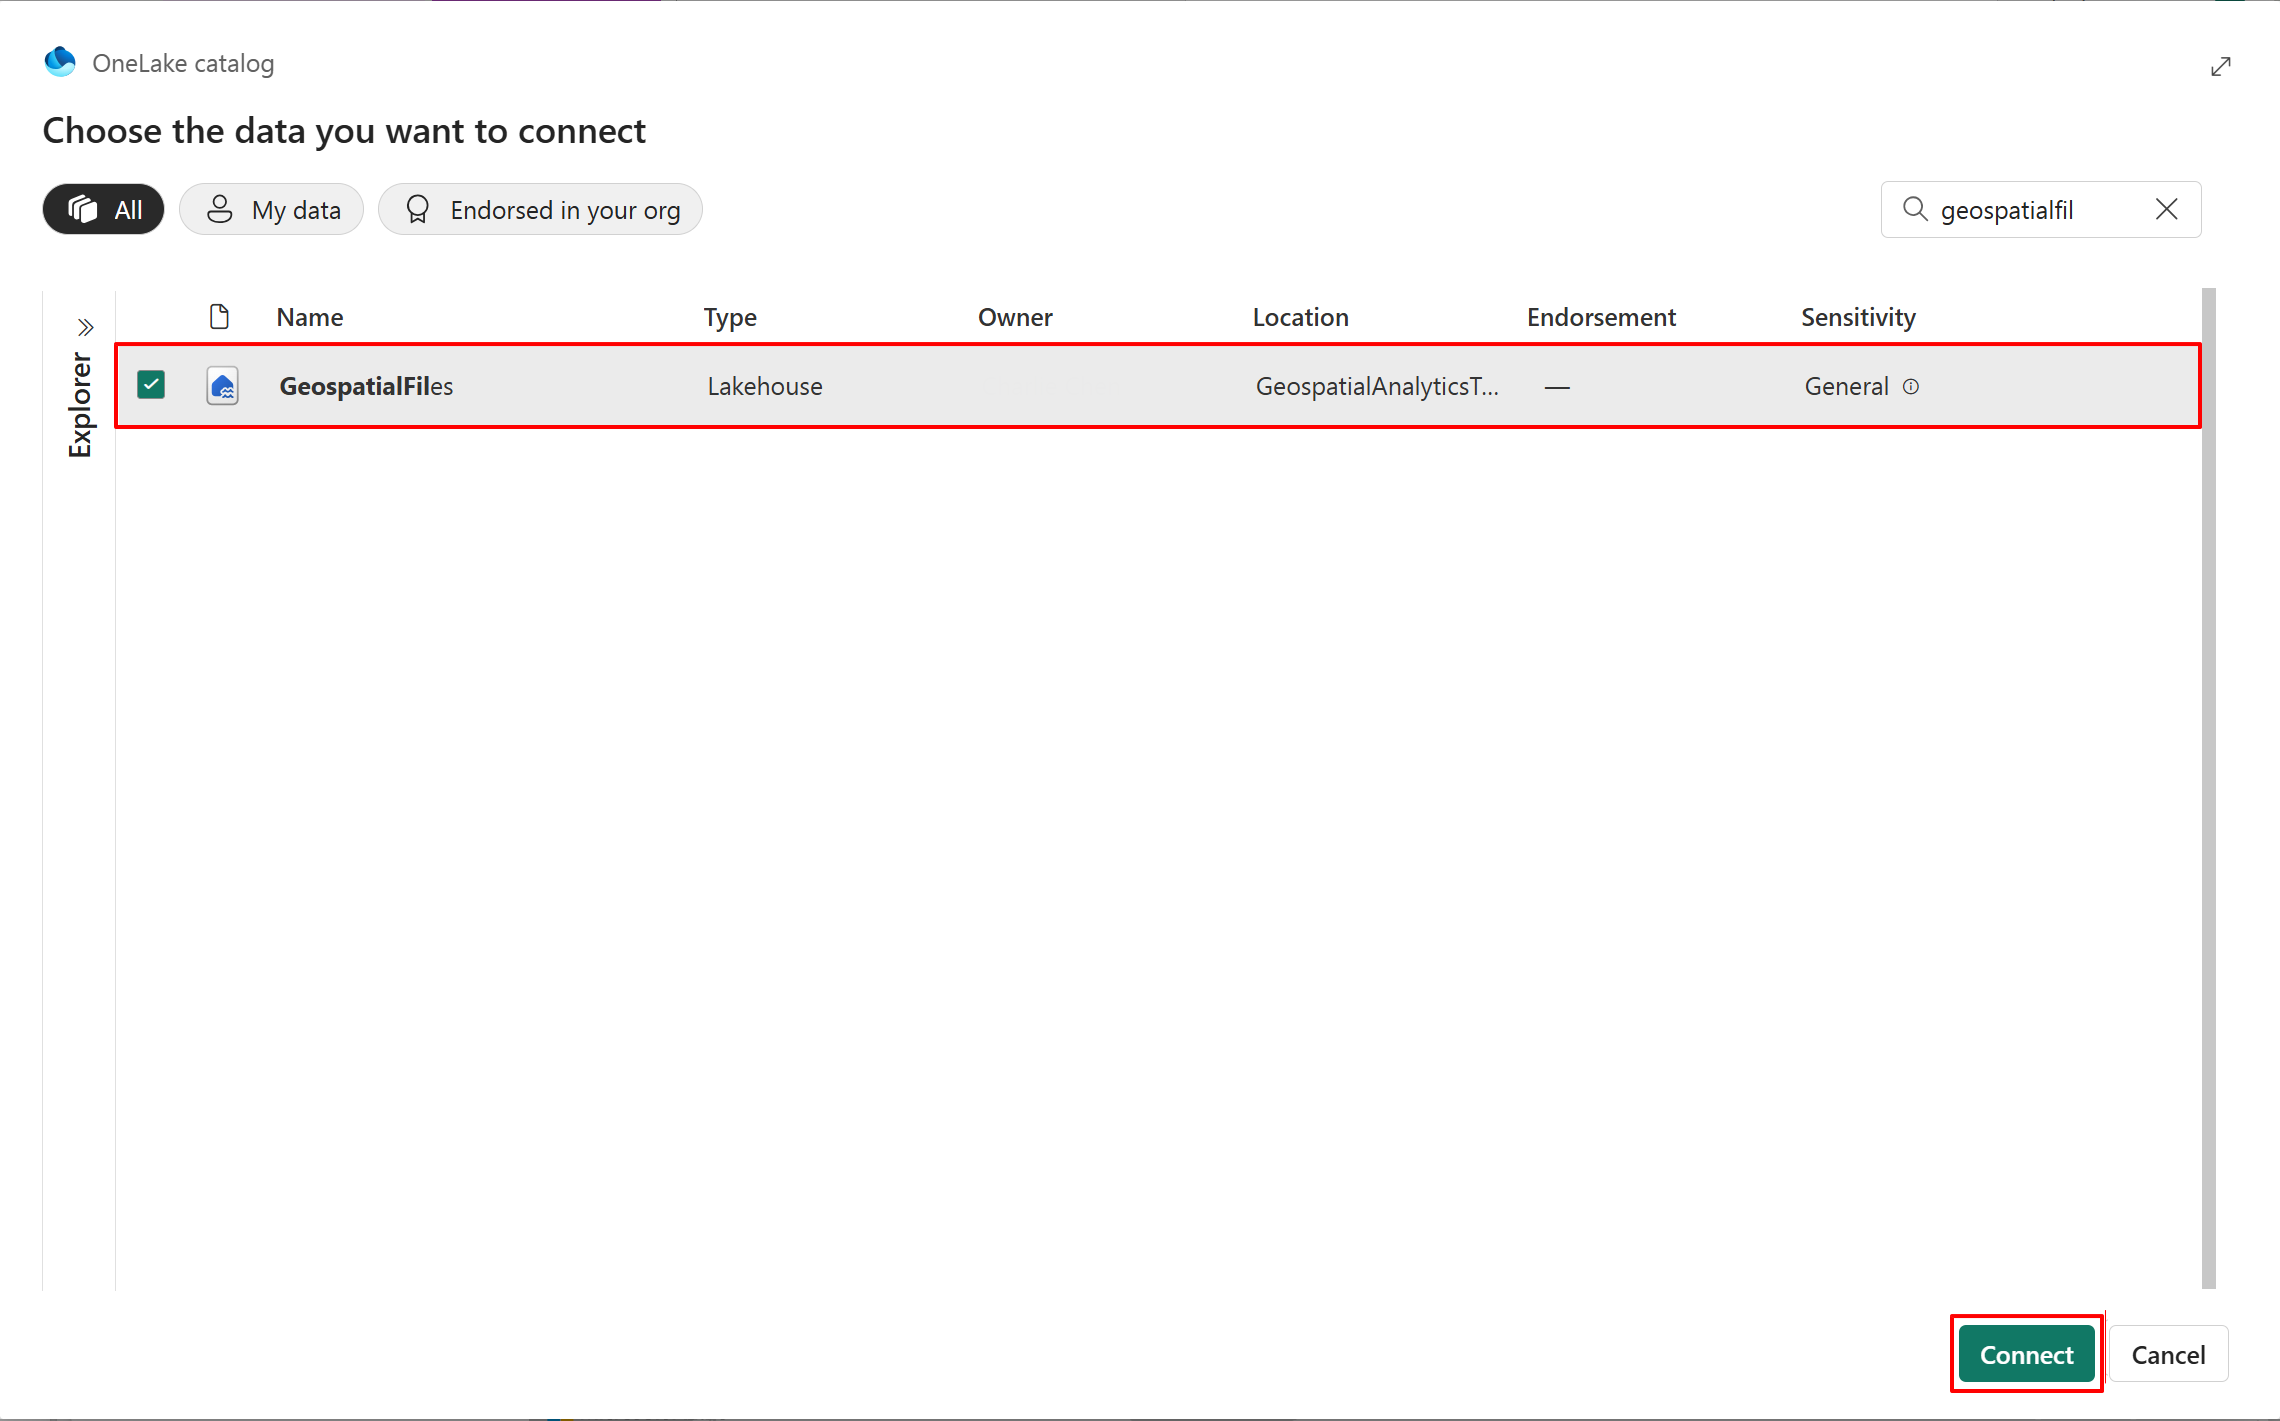
- The OneLake catalog lists all the lakehouses that you have permission to access. Use the search box if needed. Select Connect to connect the selected lakehouse to the map item.
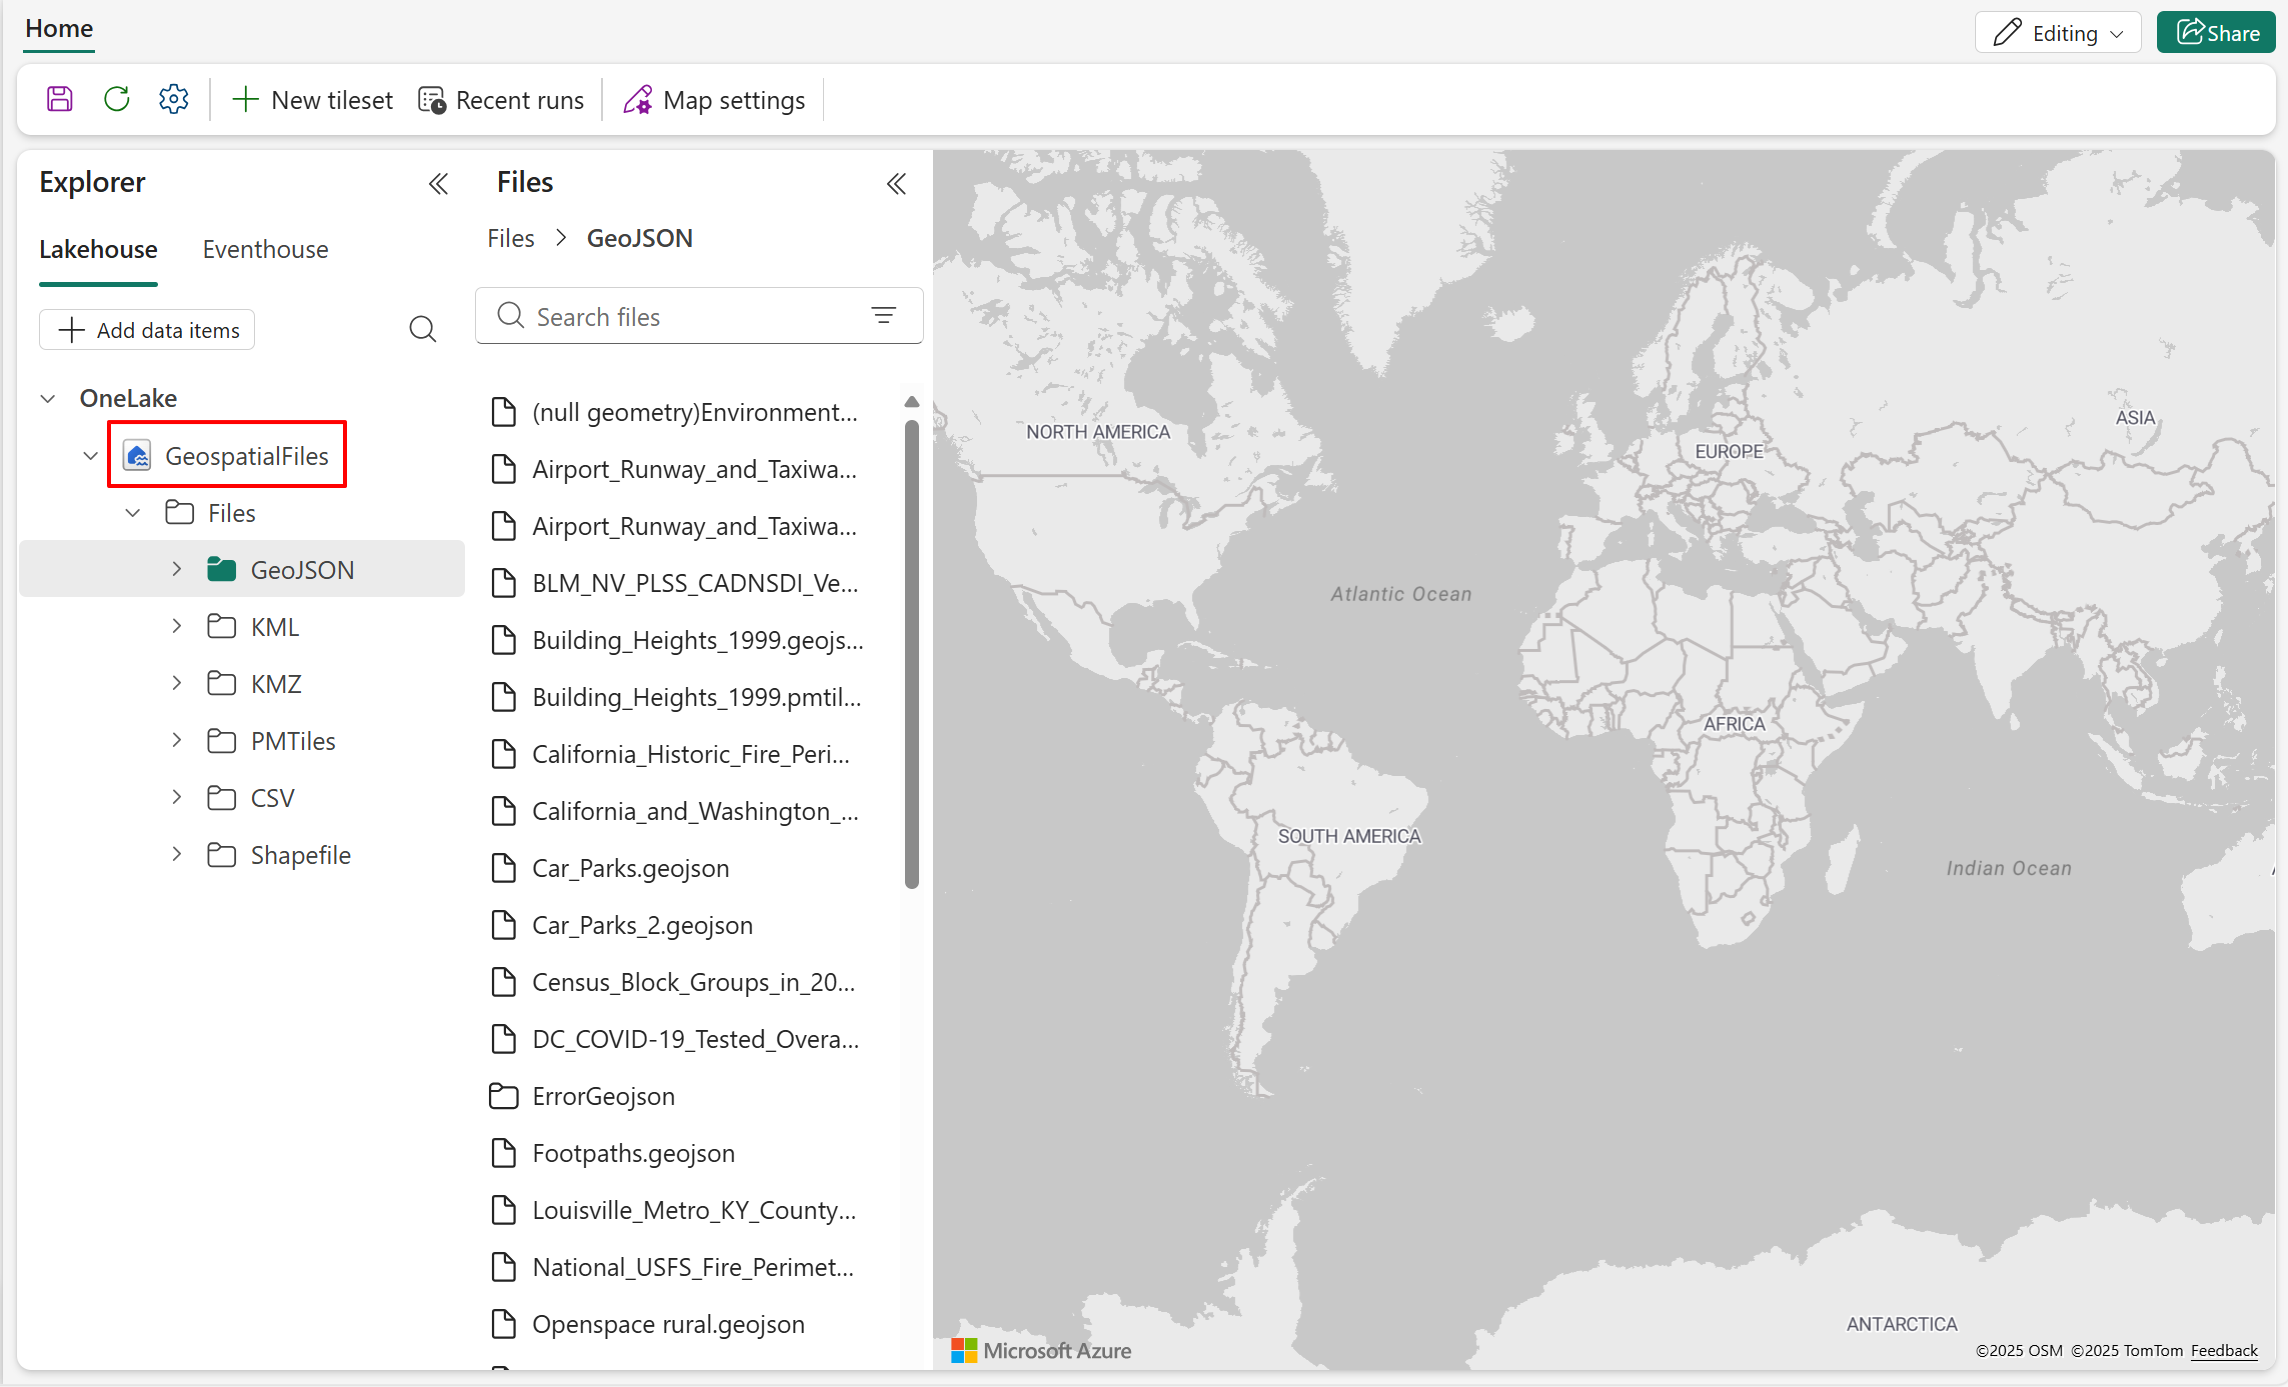
- A node now appears in the Explorer pane. Expand it to view the directories and detailed file list in the Files pane.


Lakehouse supported data types and limitations
Currently Map supports the following data types:
- GeoJSON format with .geojson file extension and size limitation up to 20MB.
- PMTiles format with .pmtiles file extension.
Note
GeoJSON files larger than 20MB must be converted into a tileset in order to be used by Microsoft Fabric Map. For more information on how to convert a GeoJSON file into tileset, see Create a tileset.
Add data to map - GeoJSON
- Right-click the GeoJSON file you want to render on the map, then select Show on map. The map immediately renders the file's spatial data using default settings.

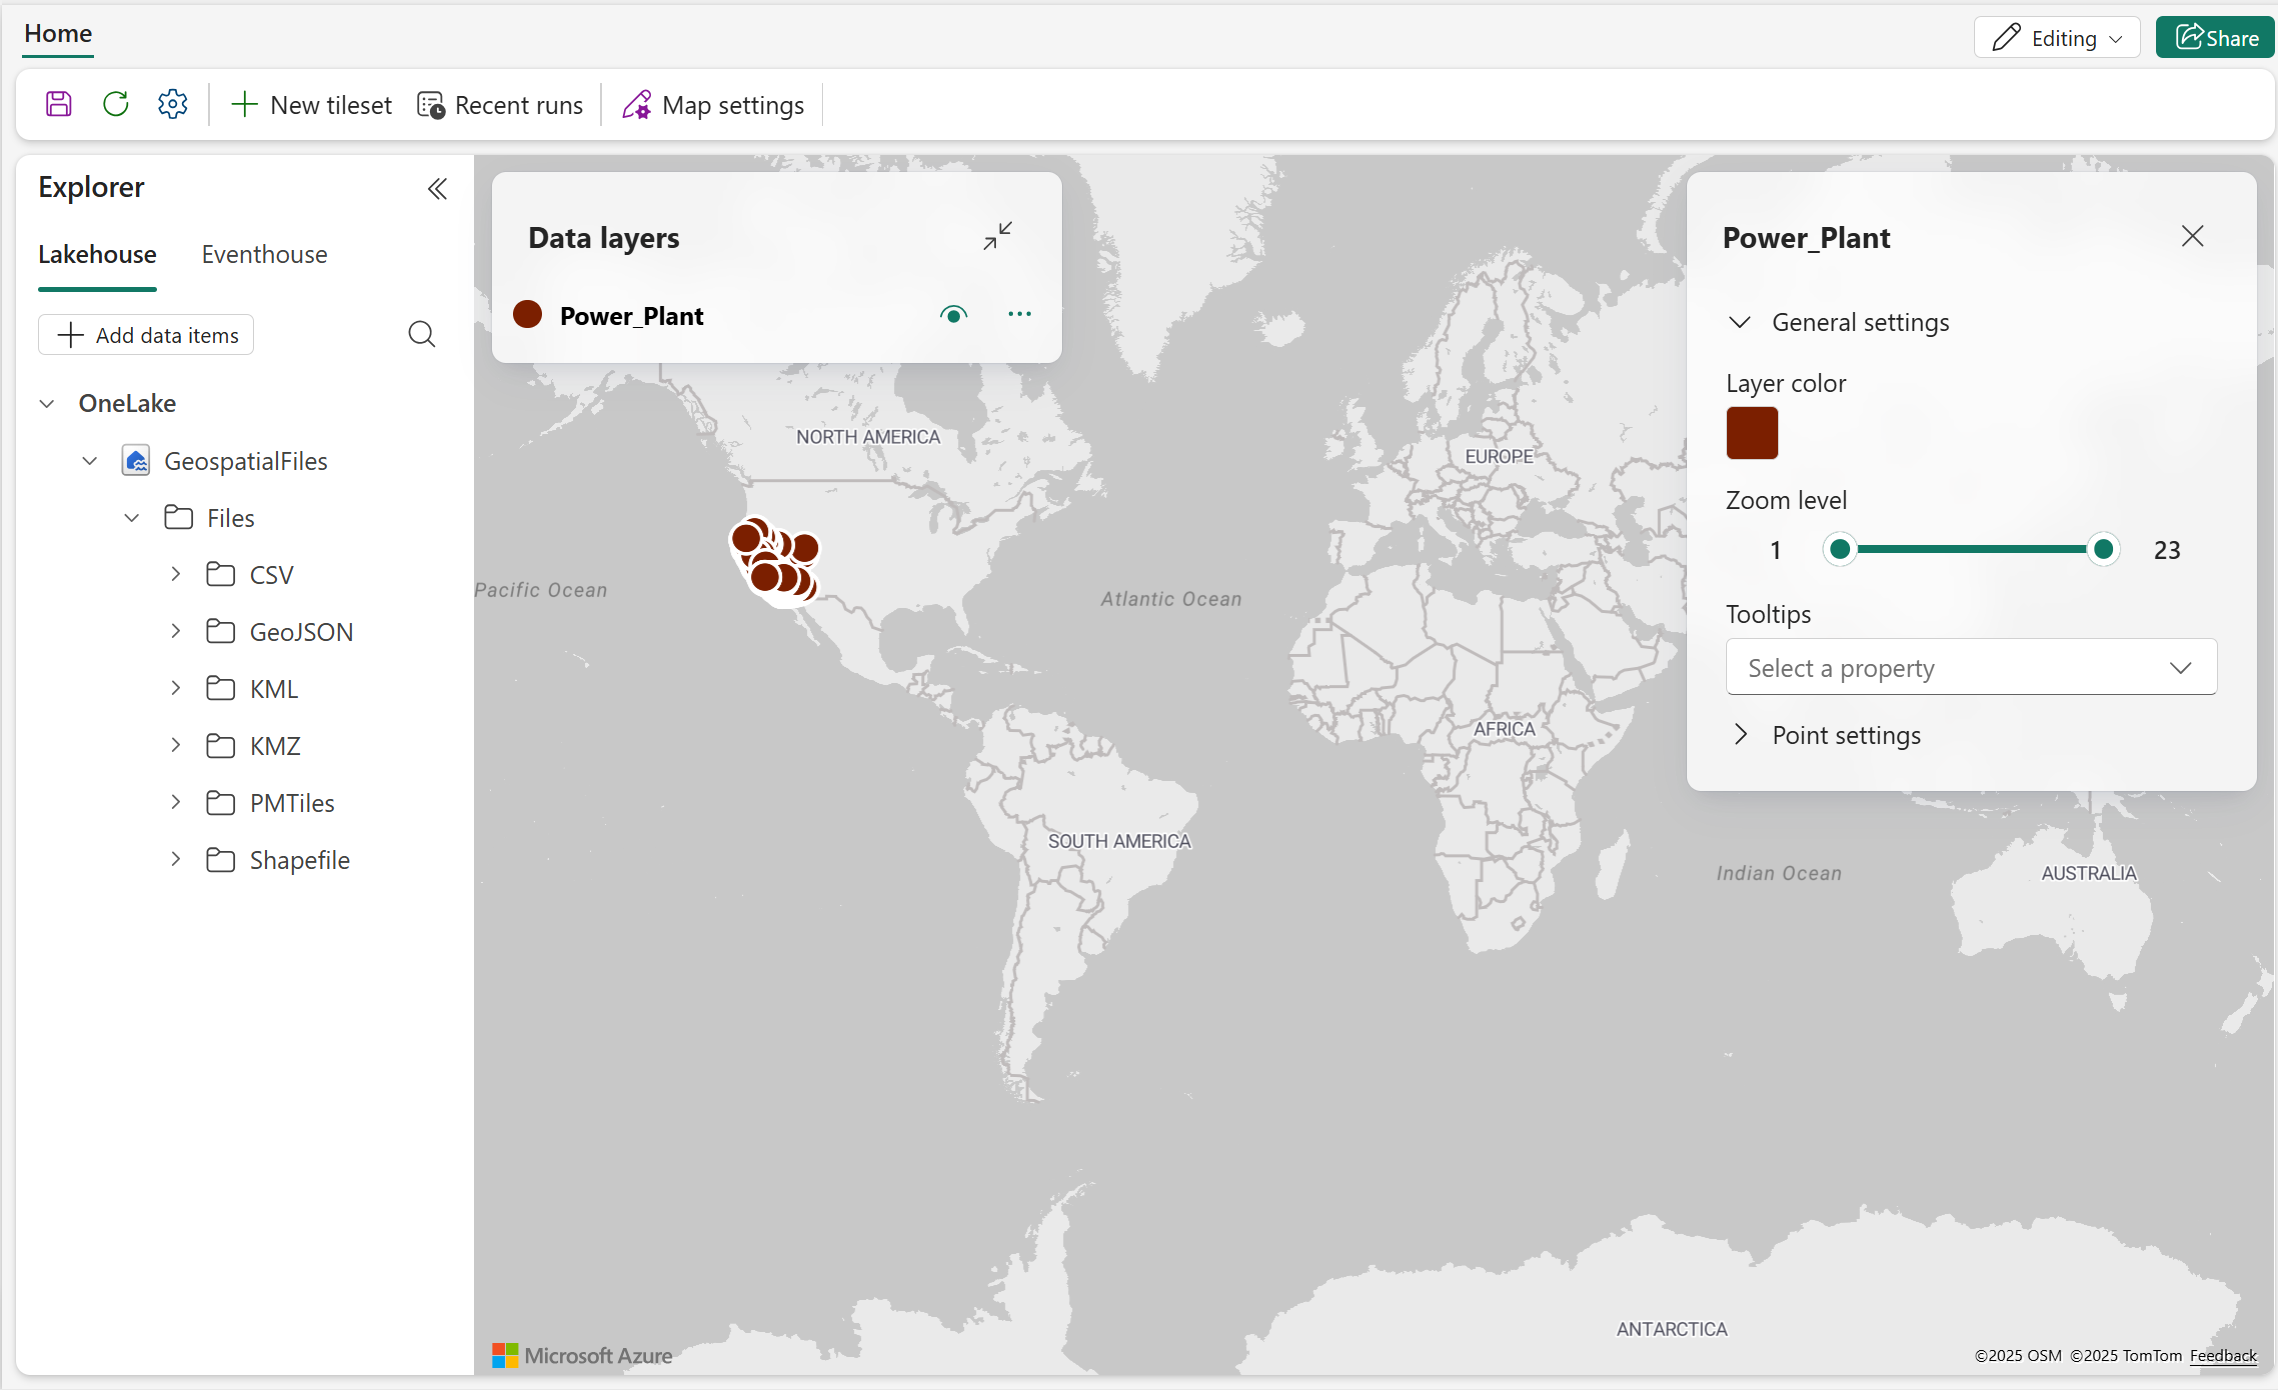
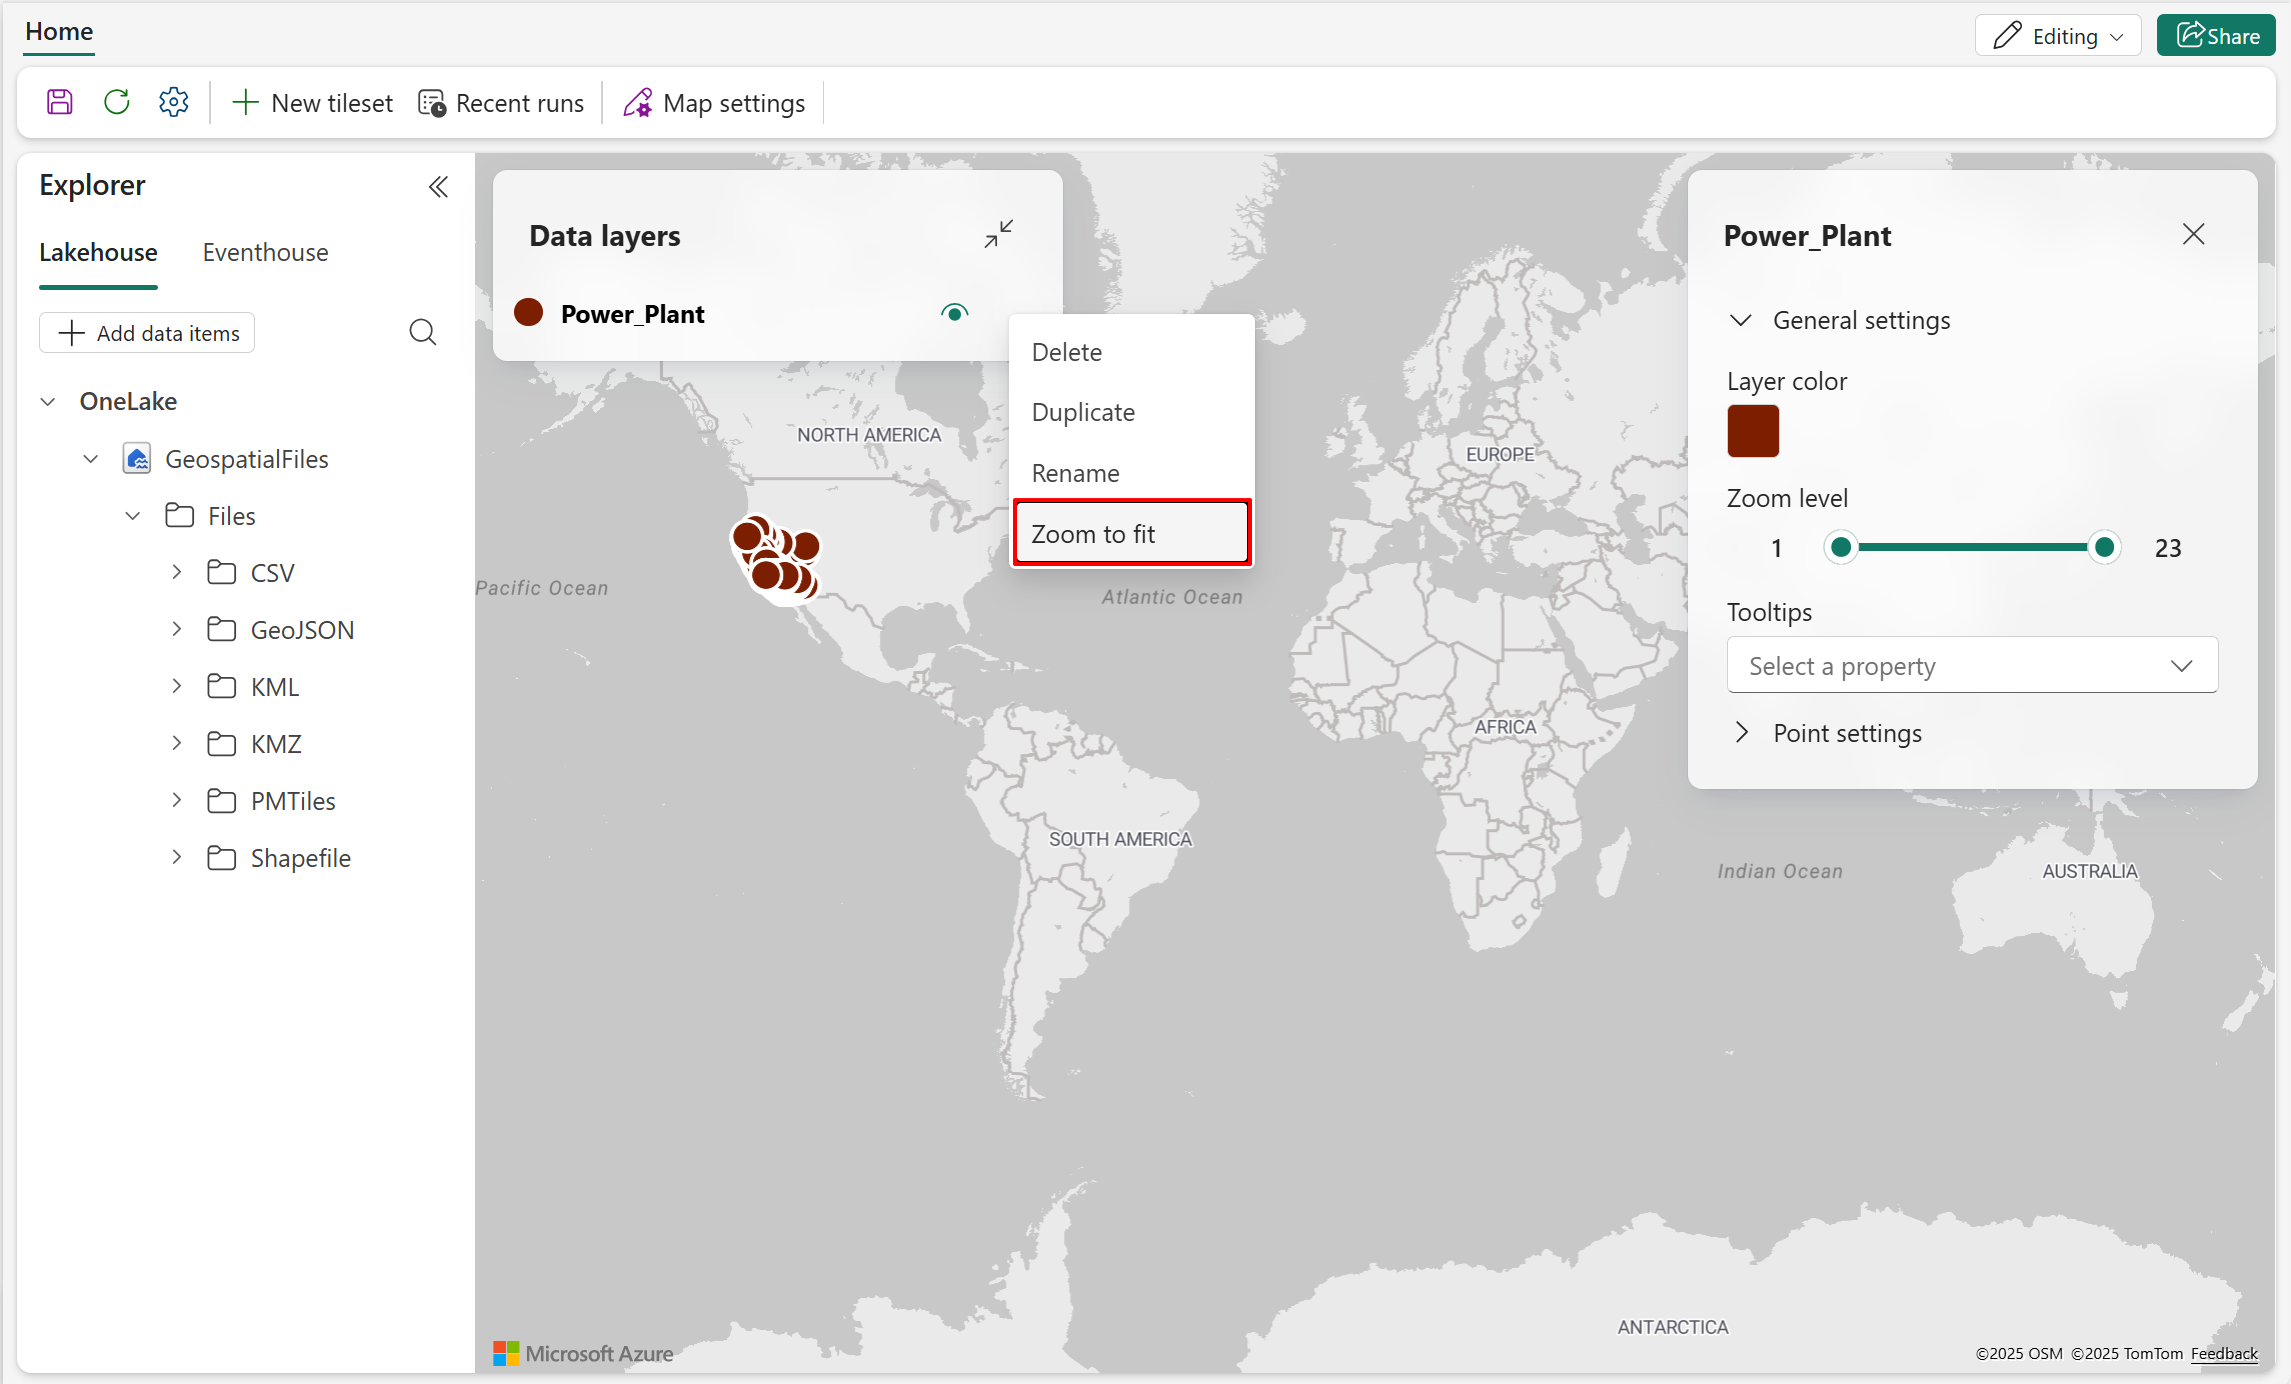
- The following screenshot shows the data layer added to the map. This data layer consists of power plant locations (point geometry) in California using the default layer color.
- Navigate to the Data layer pane and select the ellipsis menu (...) to show the actions available in the layer.

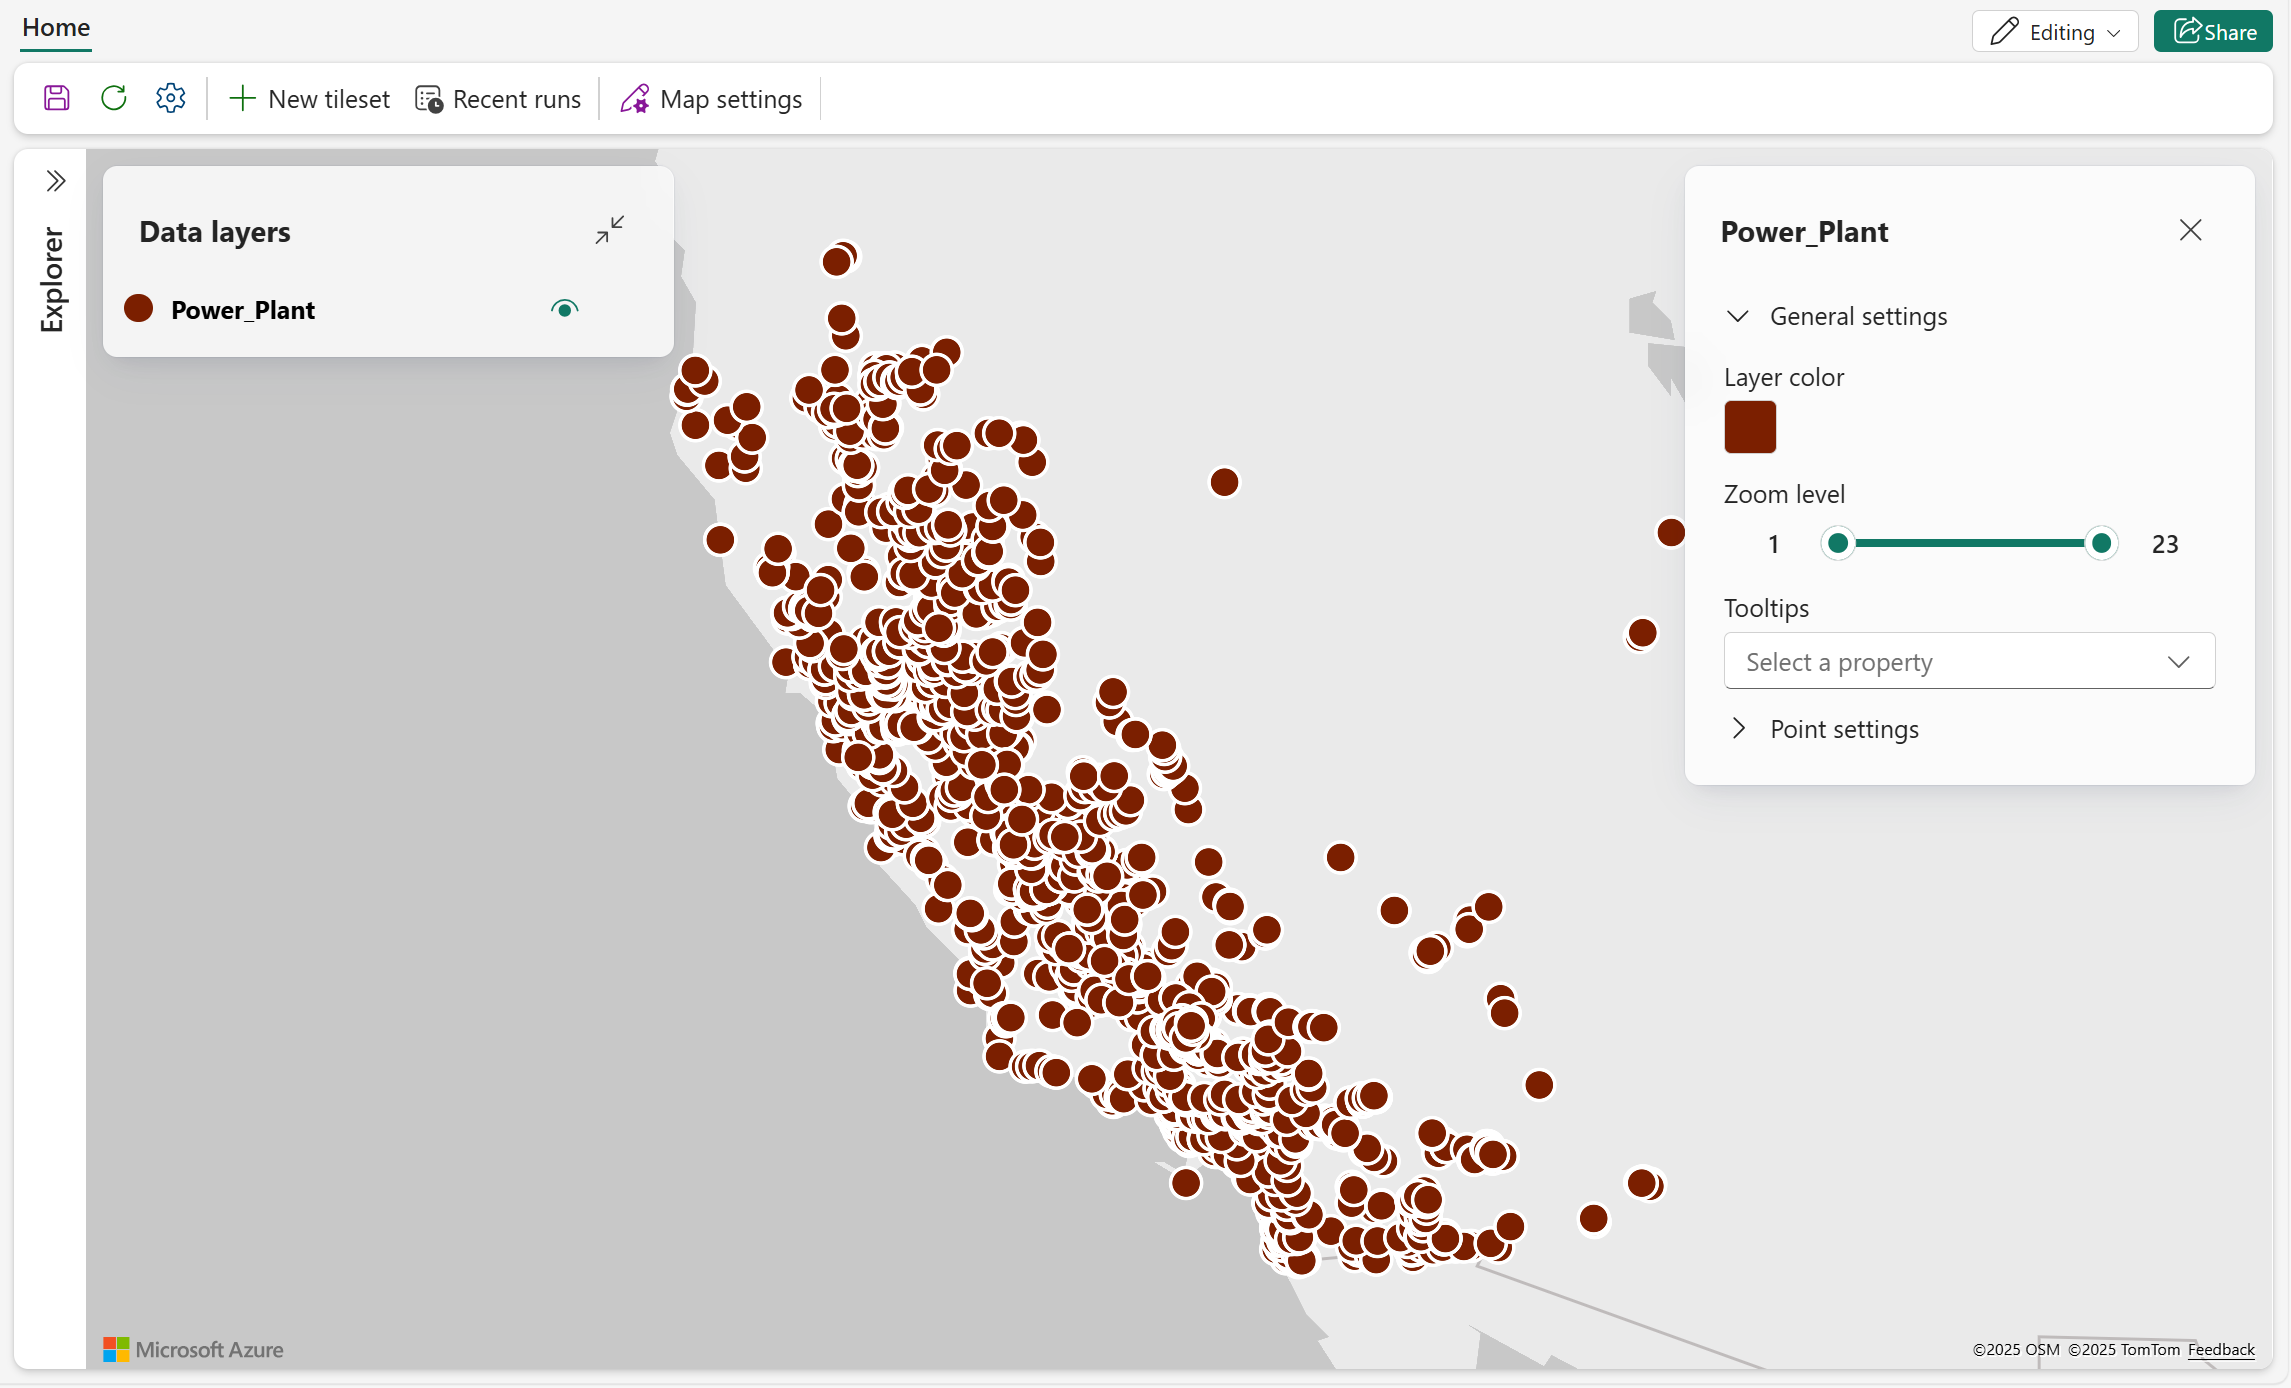
- Right-click Zoom to fit to take closer look at the data distribution.
Tip
To get a larger canvas for your map, collapse the Explorer pane to expand the map view.


There are other data layer customization options available. For more information, see Customize a map.
Add data to the map - PMTiles
- Right-click the PMTiles file you want to use, then select Show on map. The map automatically renders the spatial data using default settings.
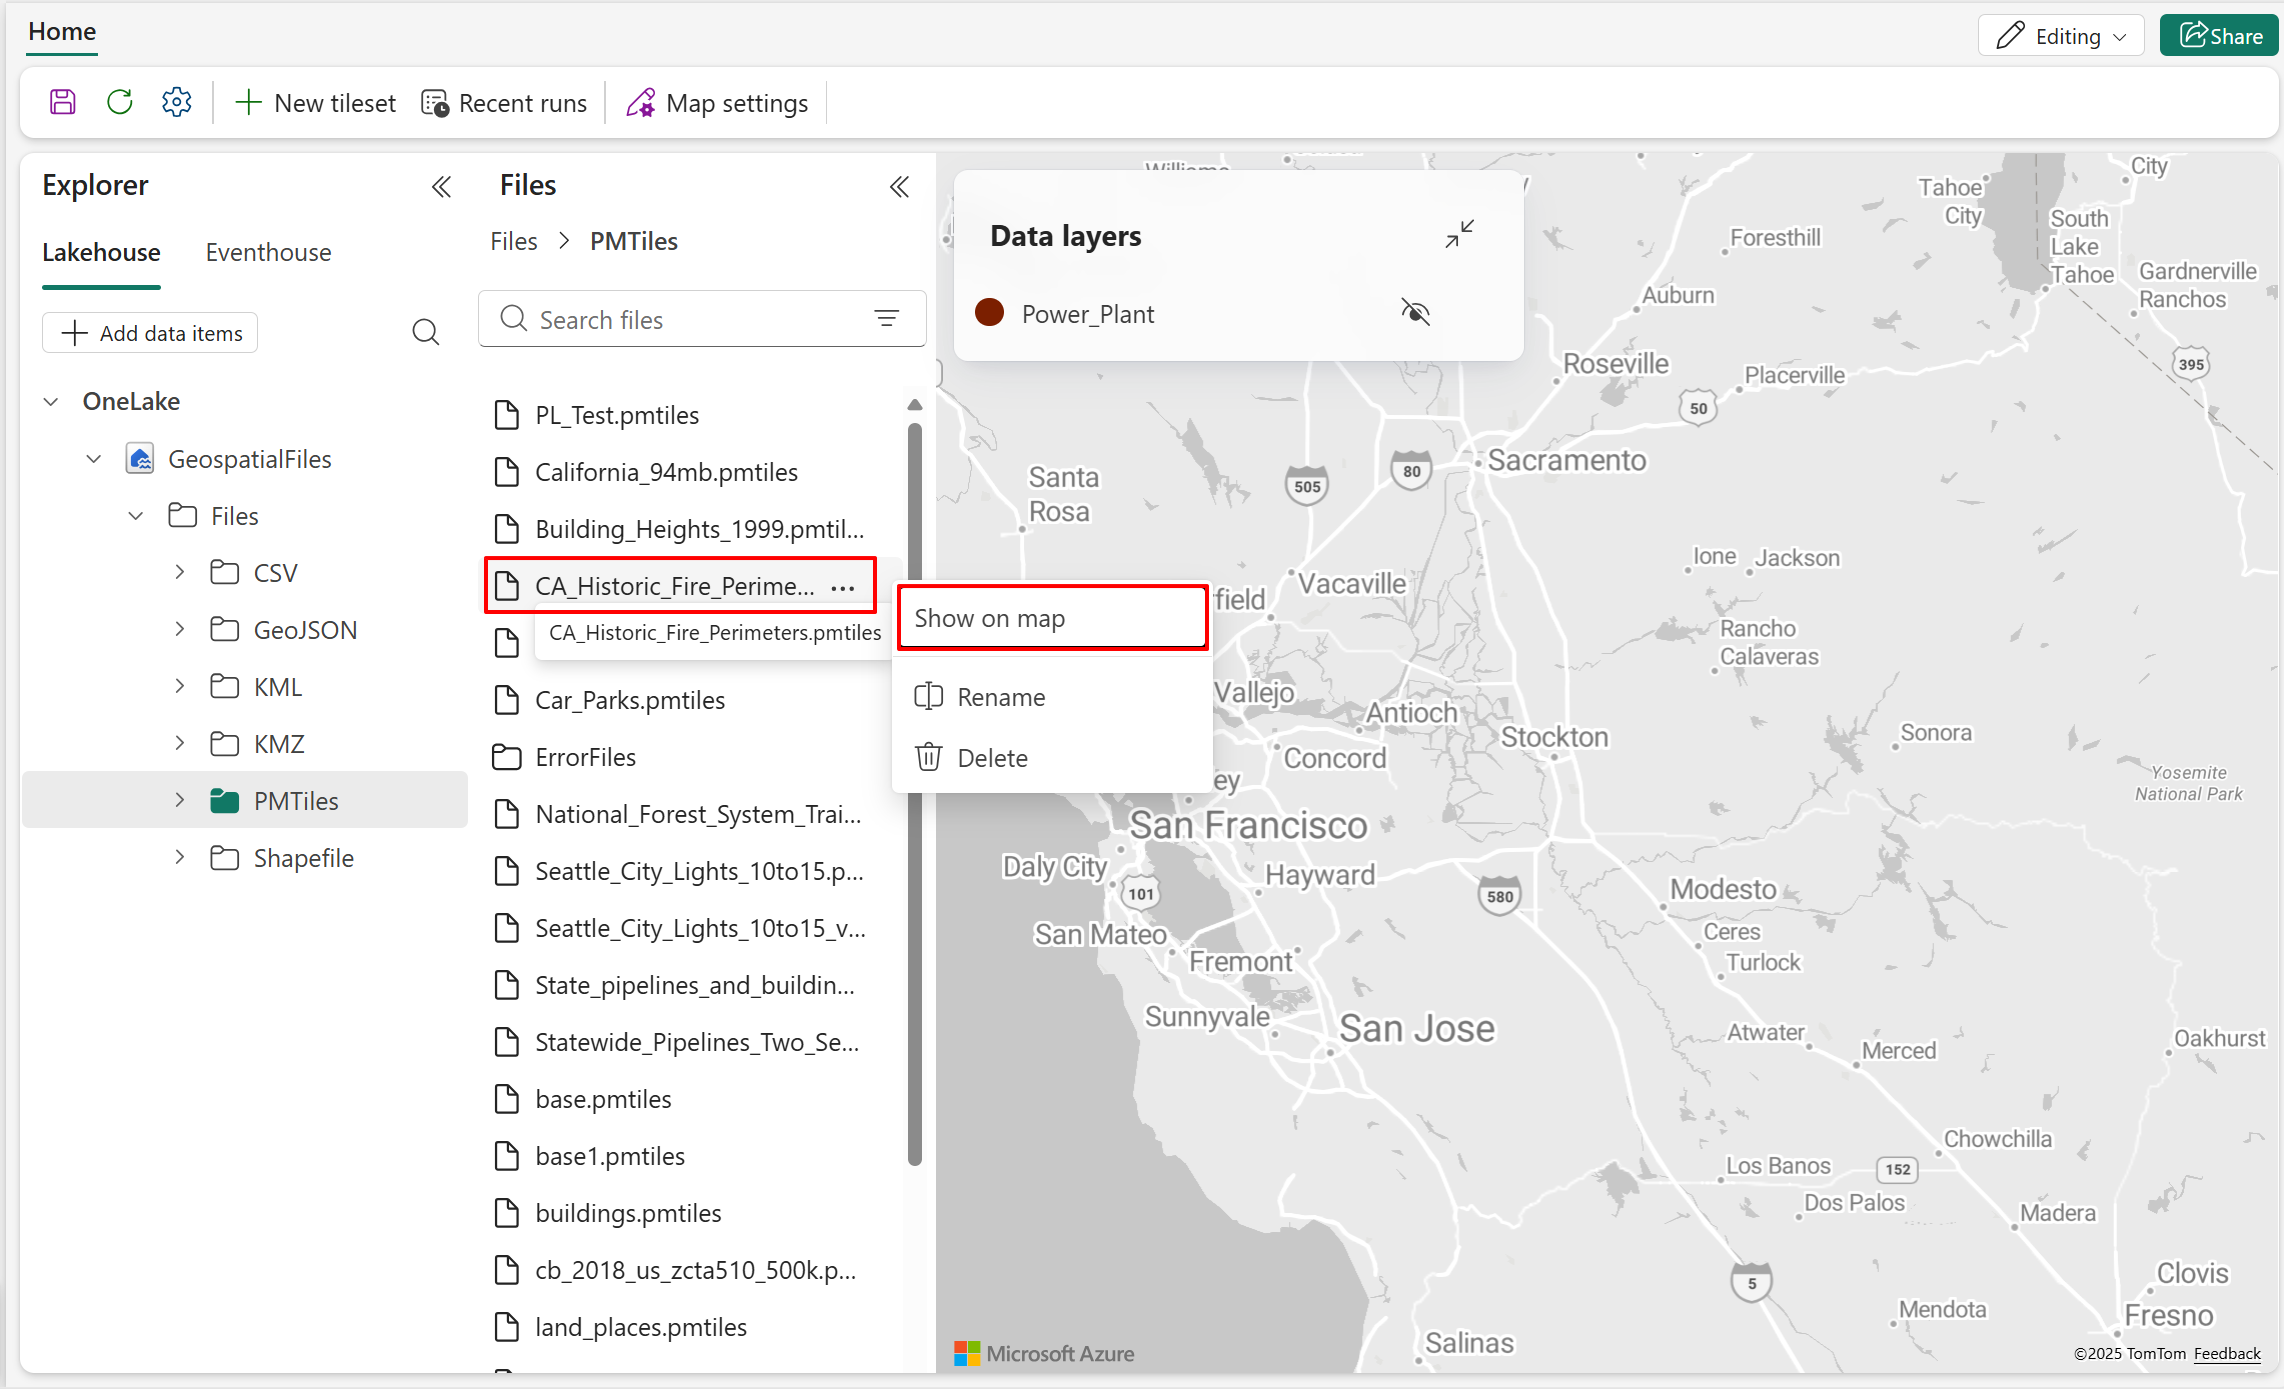

The following screenshot shows the new data layer added to the map with the default layer color. The new data layer shows fire perimeter zones across California, represented using polygon geometry.

Note
Zoom to fit is available for PMTiles when bounds information is included in the metadata.
For more information on data layer customization, see Customize a map.
Connect to Eventhouse/KQL databases
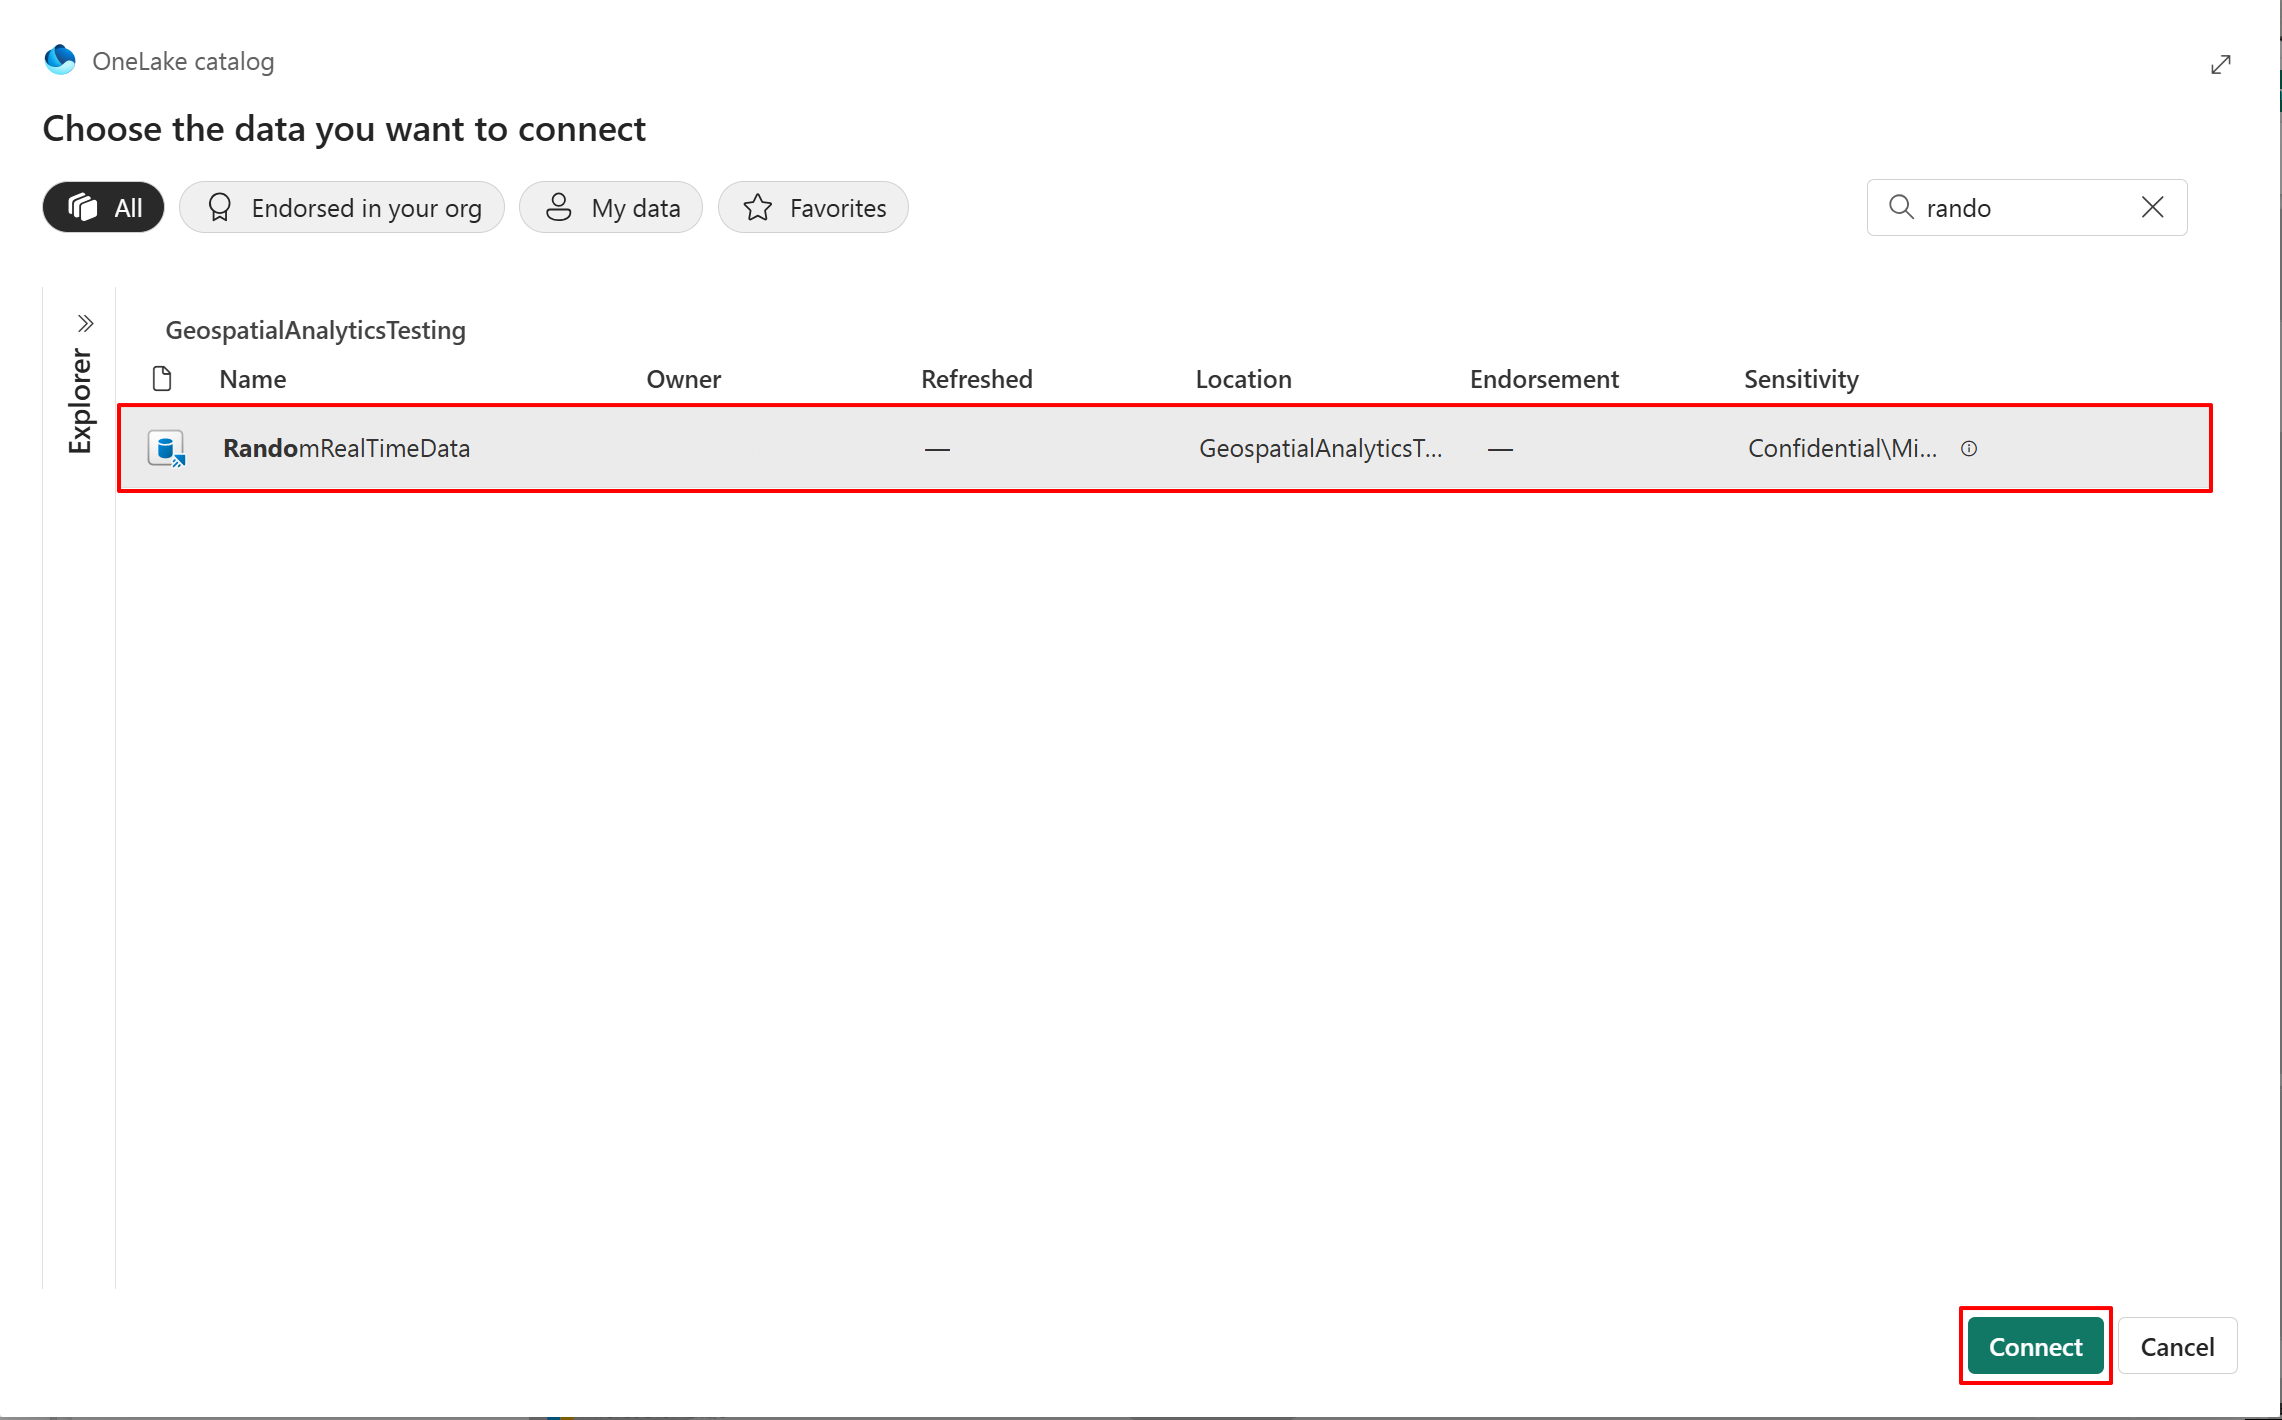
- Switch to the Eventhouse tab and select Add data items to open the OneLake catalog.
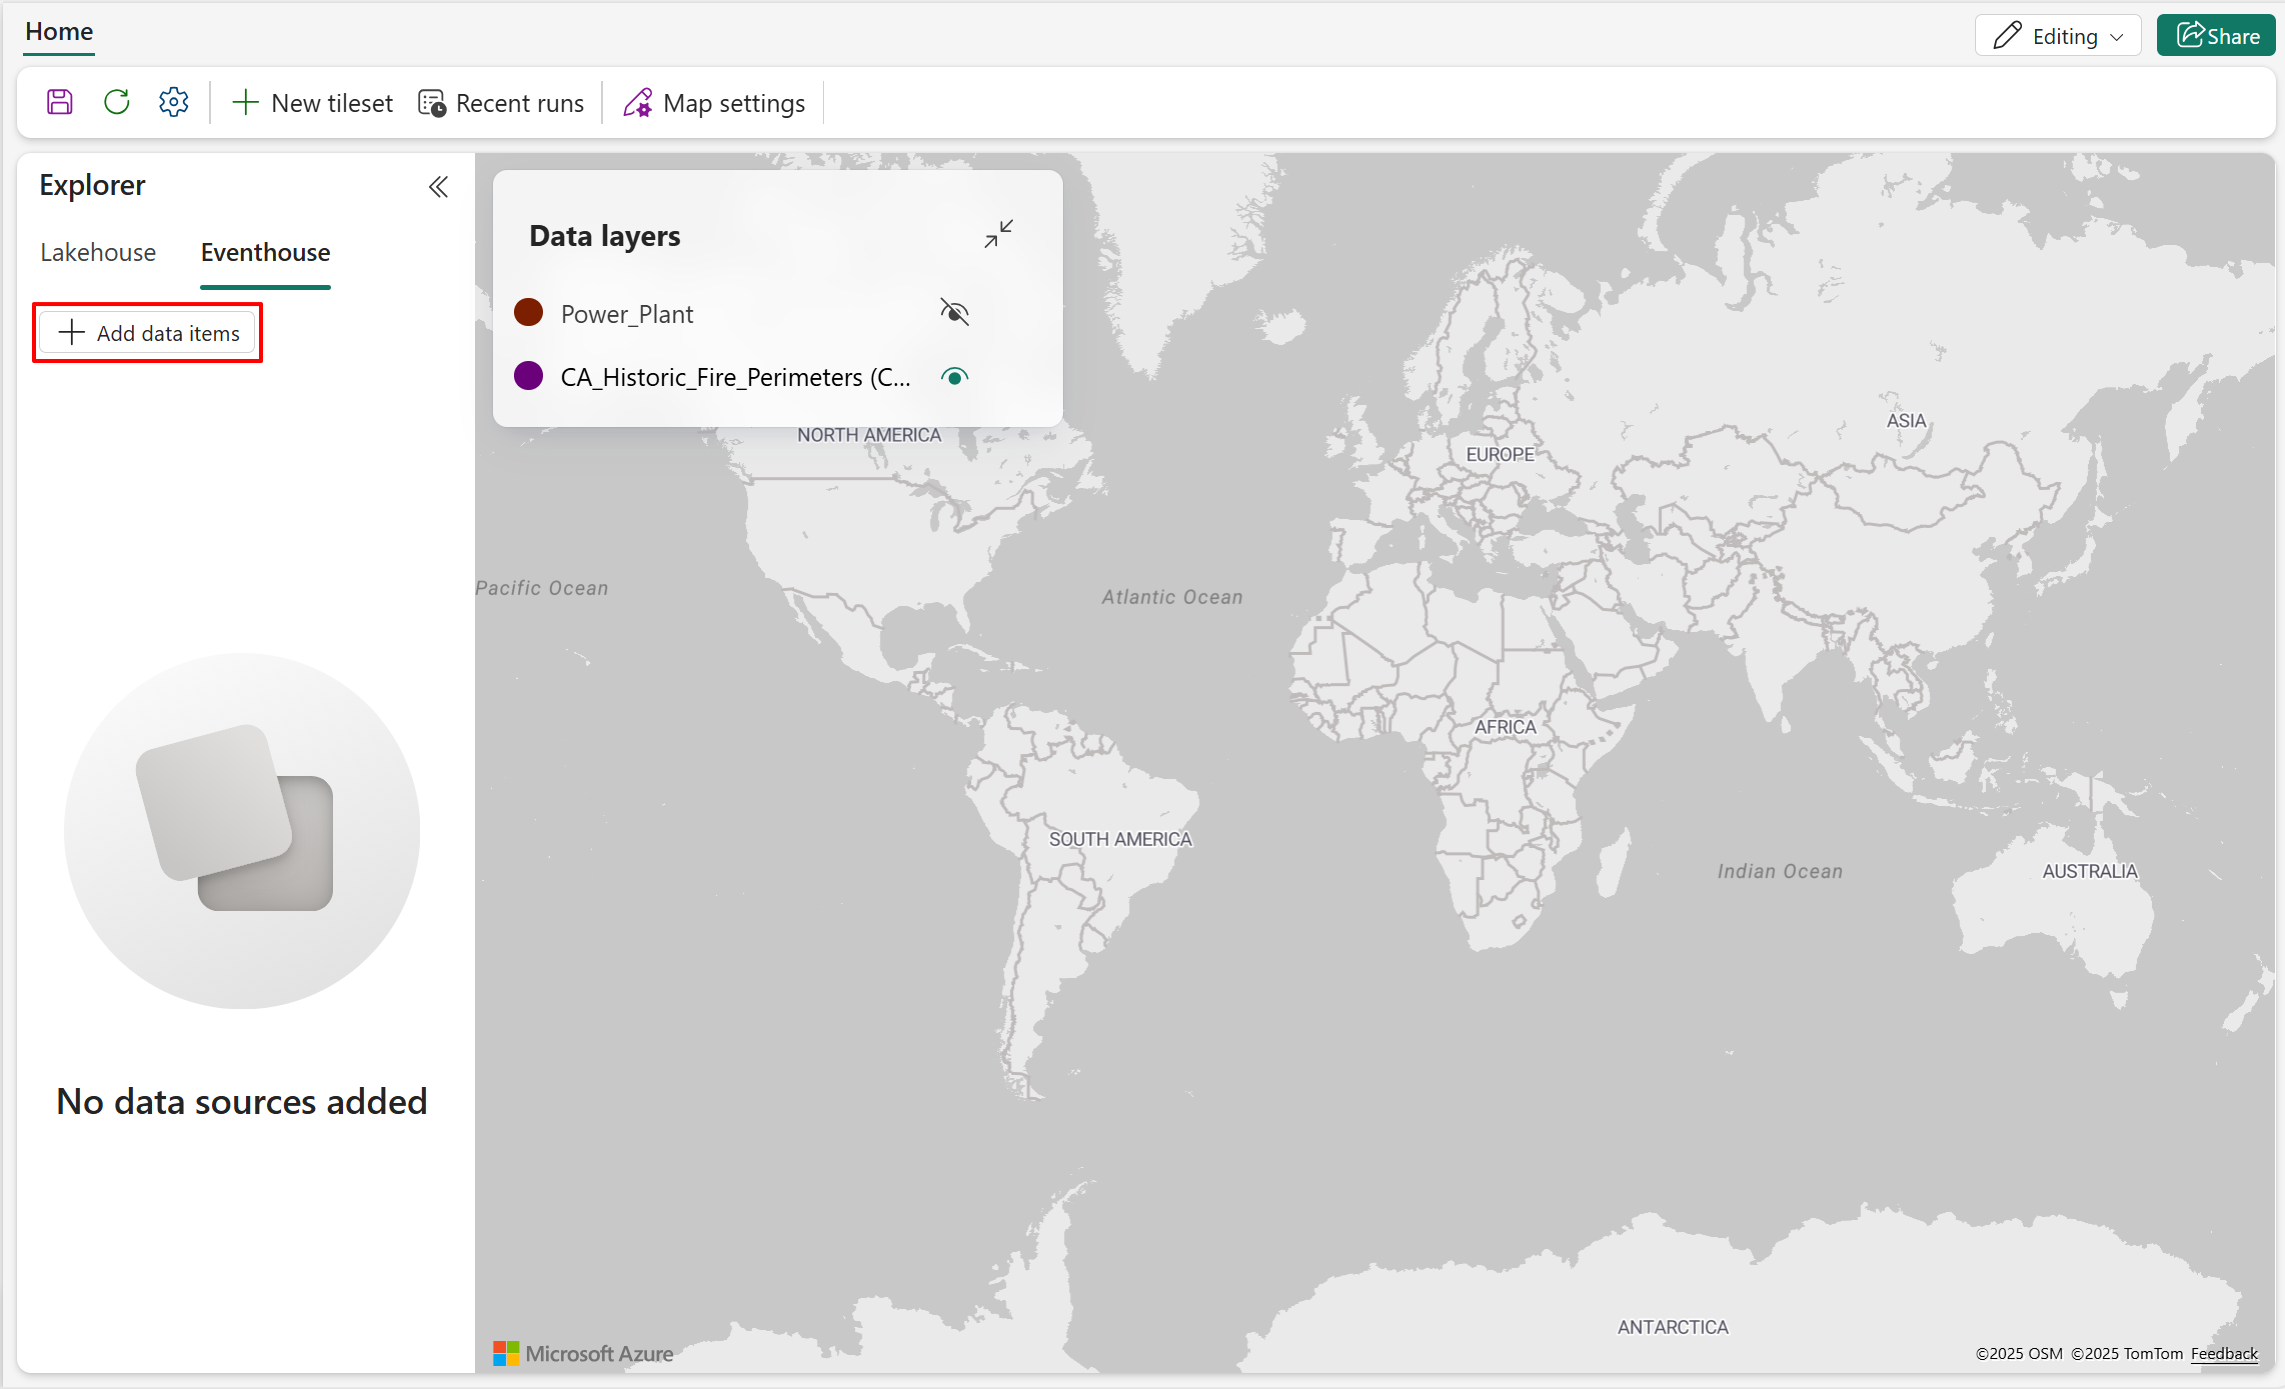
- The OneLake catalog displays all KQL databases the user is authorized to access. Select Connect to link a KQL Database under Eventhouse to this map item.
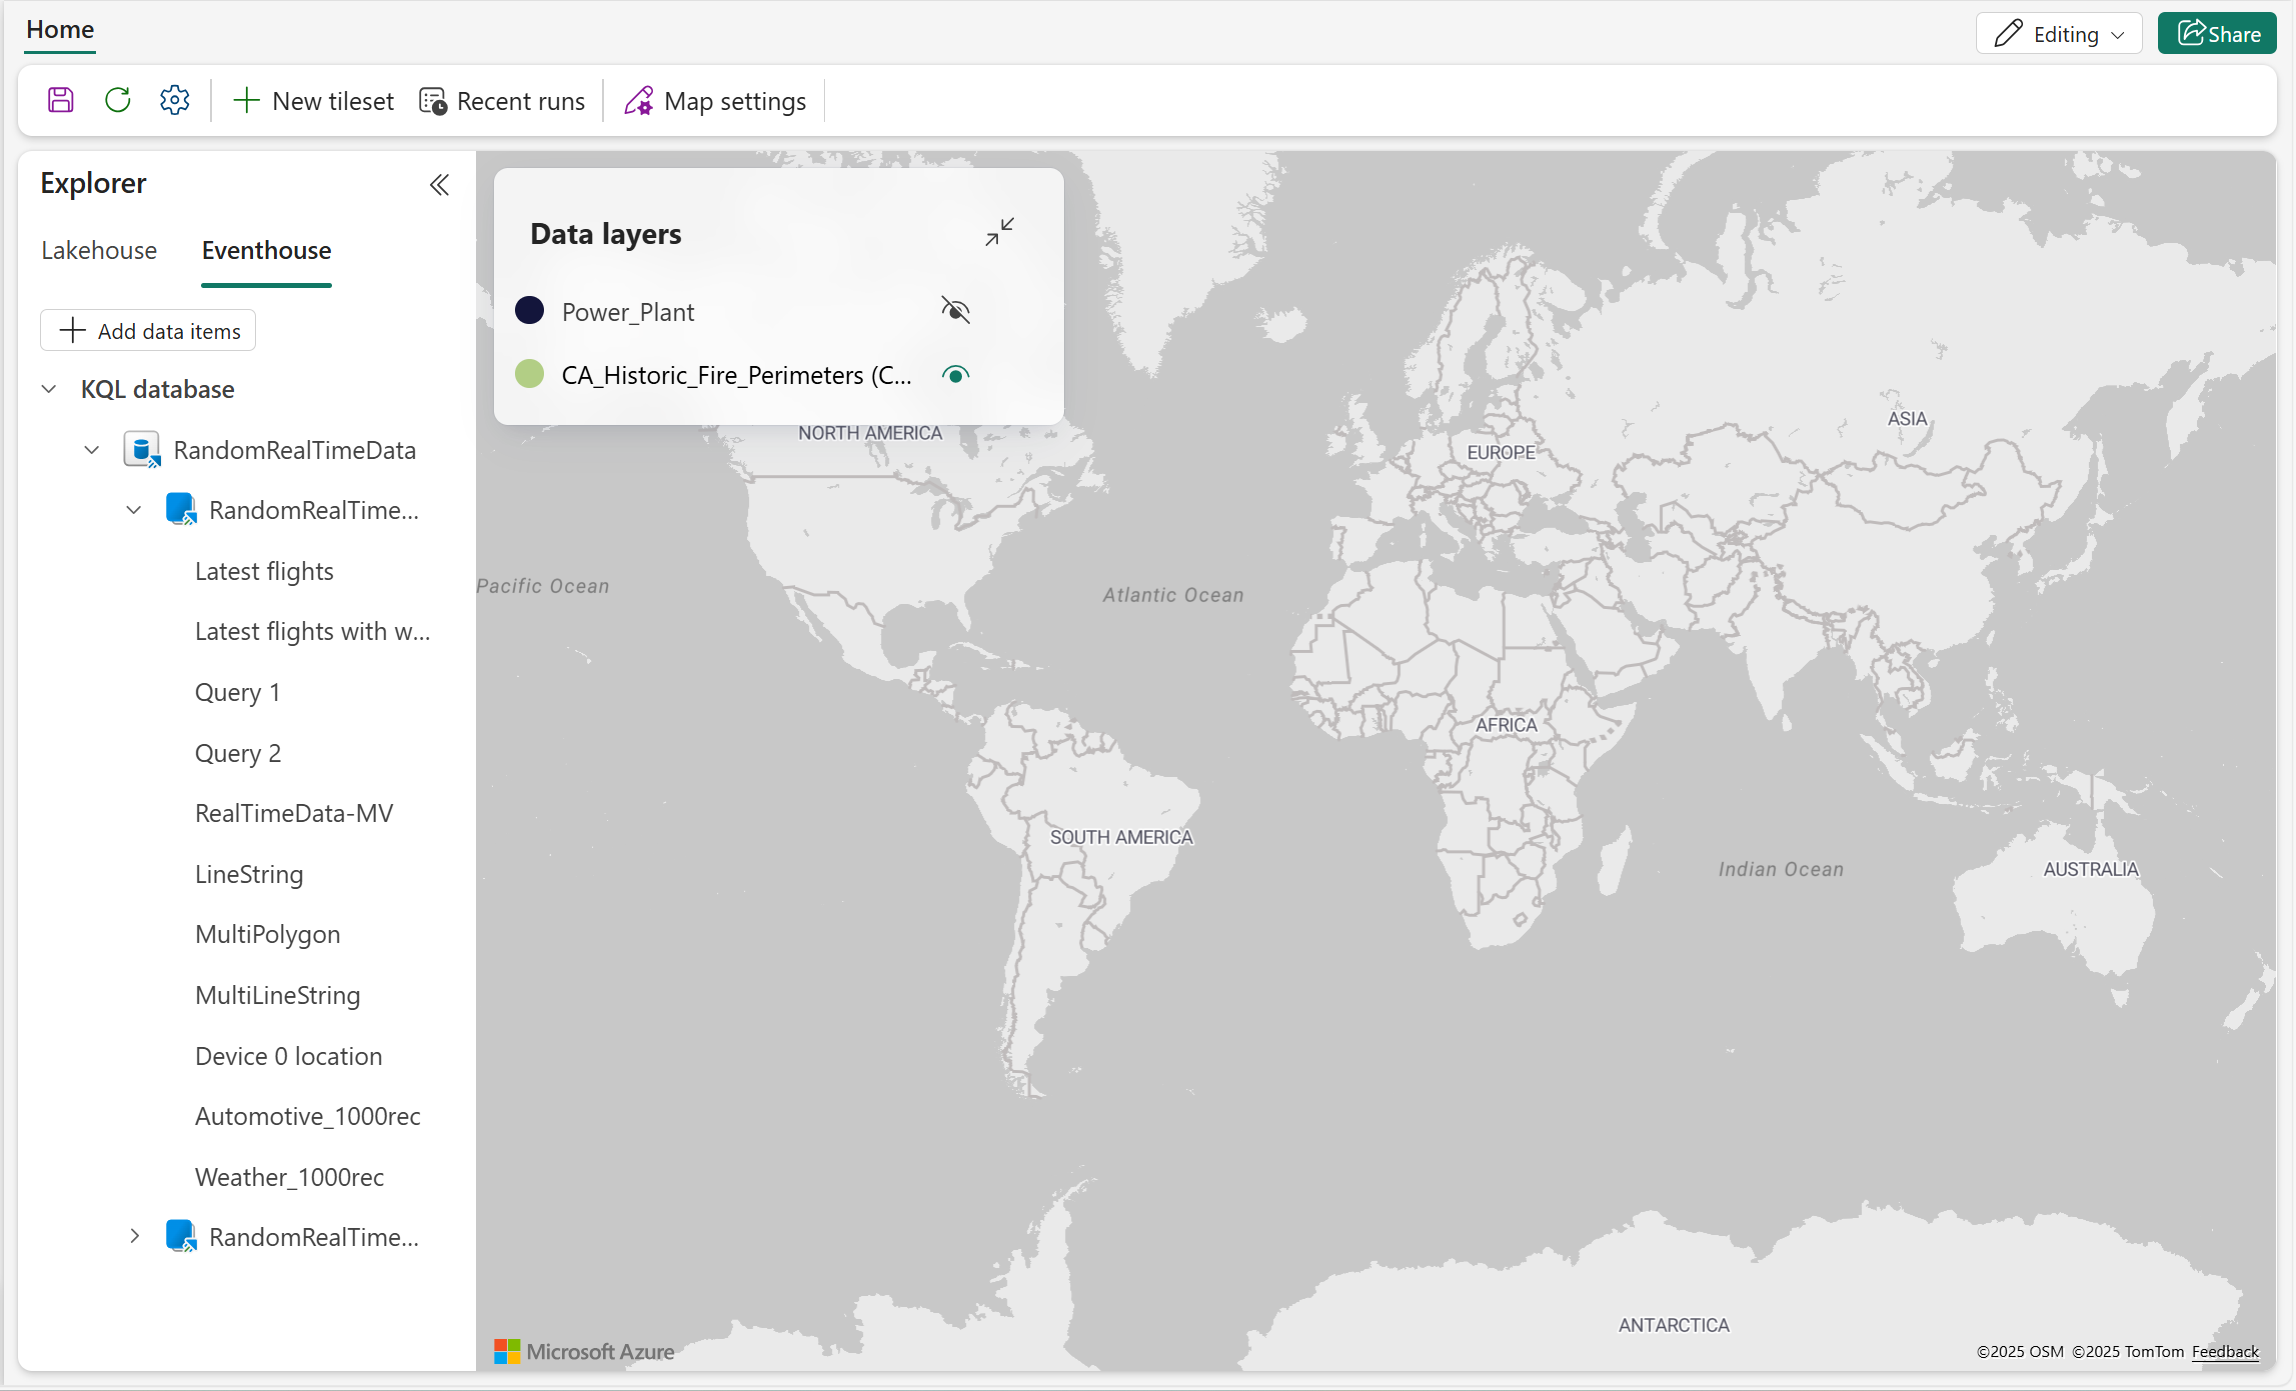
- Expand the left pane to view the internal KQL queryset and KQL queries.


Eventhouse support
Map supports Internal KQL Querysets created with the KQL Database:

But doesn't support:
- Workspace-level KQL Querysets.
- Management commands aren't supported in KQL queries.
Note
Each tab supports only one query. Using multiple queries in a single tab results in a syntax error.
Use KQL queries to add data to map
Note
Prepare the KQL queries before rendering begins on the Map, and ensure they include spatial data. Use the Refresh action to retrieve the latest KQL queries from the KQL Database.
- Select the KQL query that you want to render on the map by right-clicking on it and selecting Show on map from the popup menu to launch the configuration wizard.

- In Preview data, select the desired KQL query, then select Next to proceed.

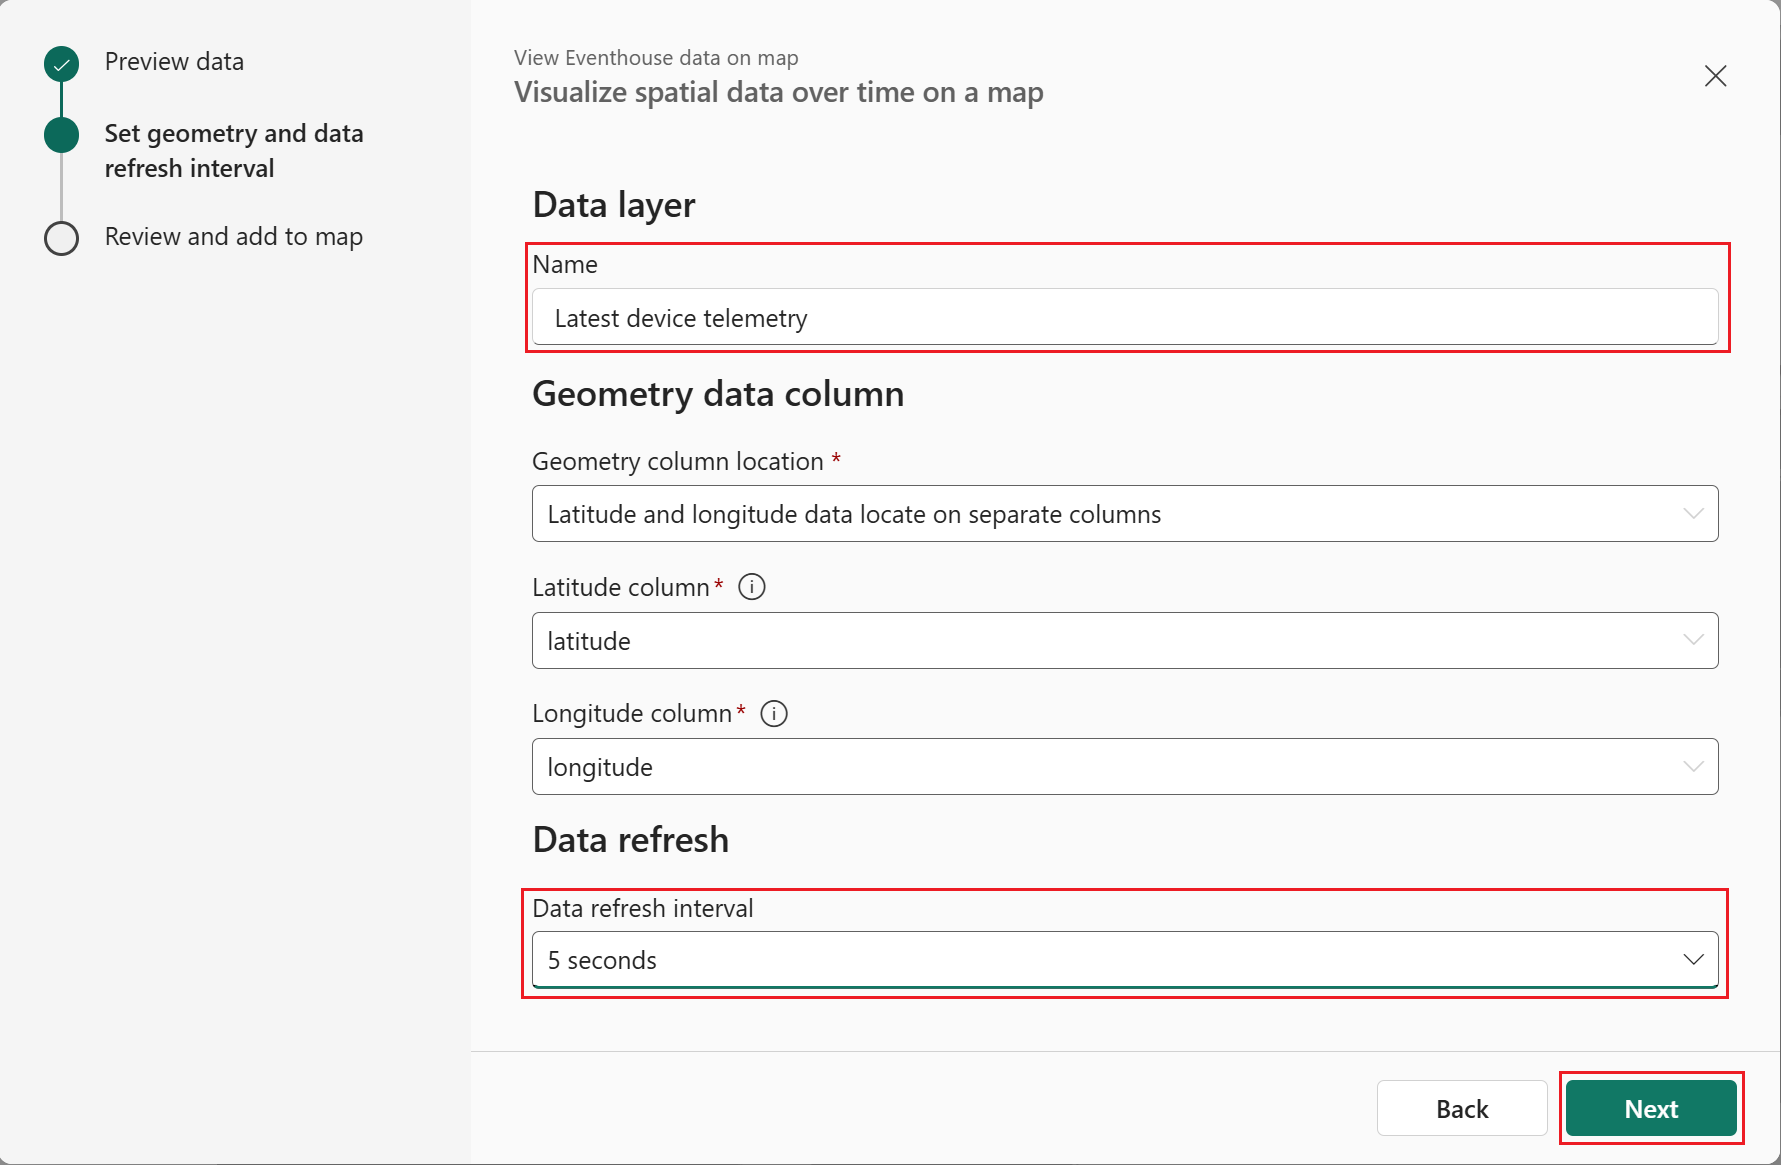
- Enter the desired name and query refresh interval, then select Next to proceed to Review and add to map.
- After reviewing the configuration, select Add to map to add the new data layer to the map.

- Select Zoom to fit from the new layers drop-down menu in the Data layers view.
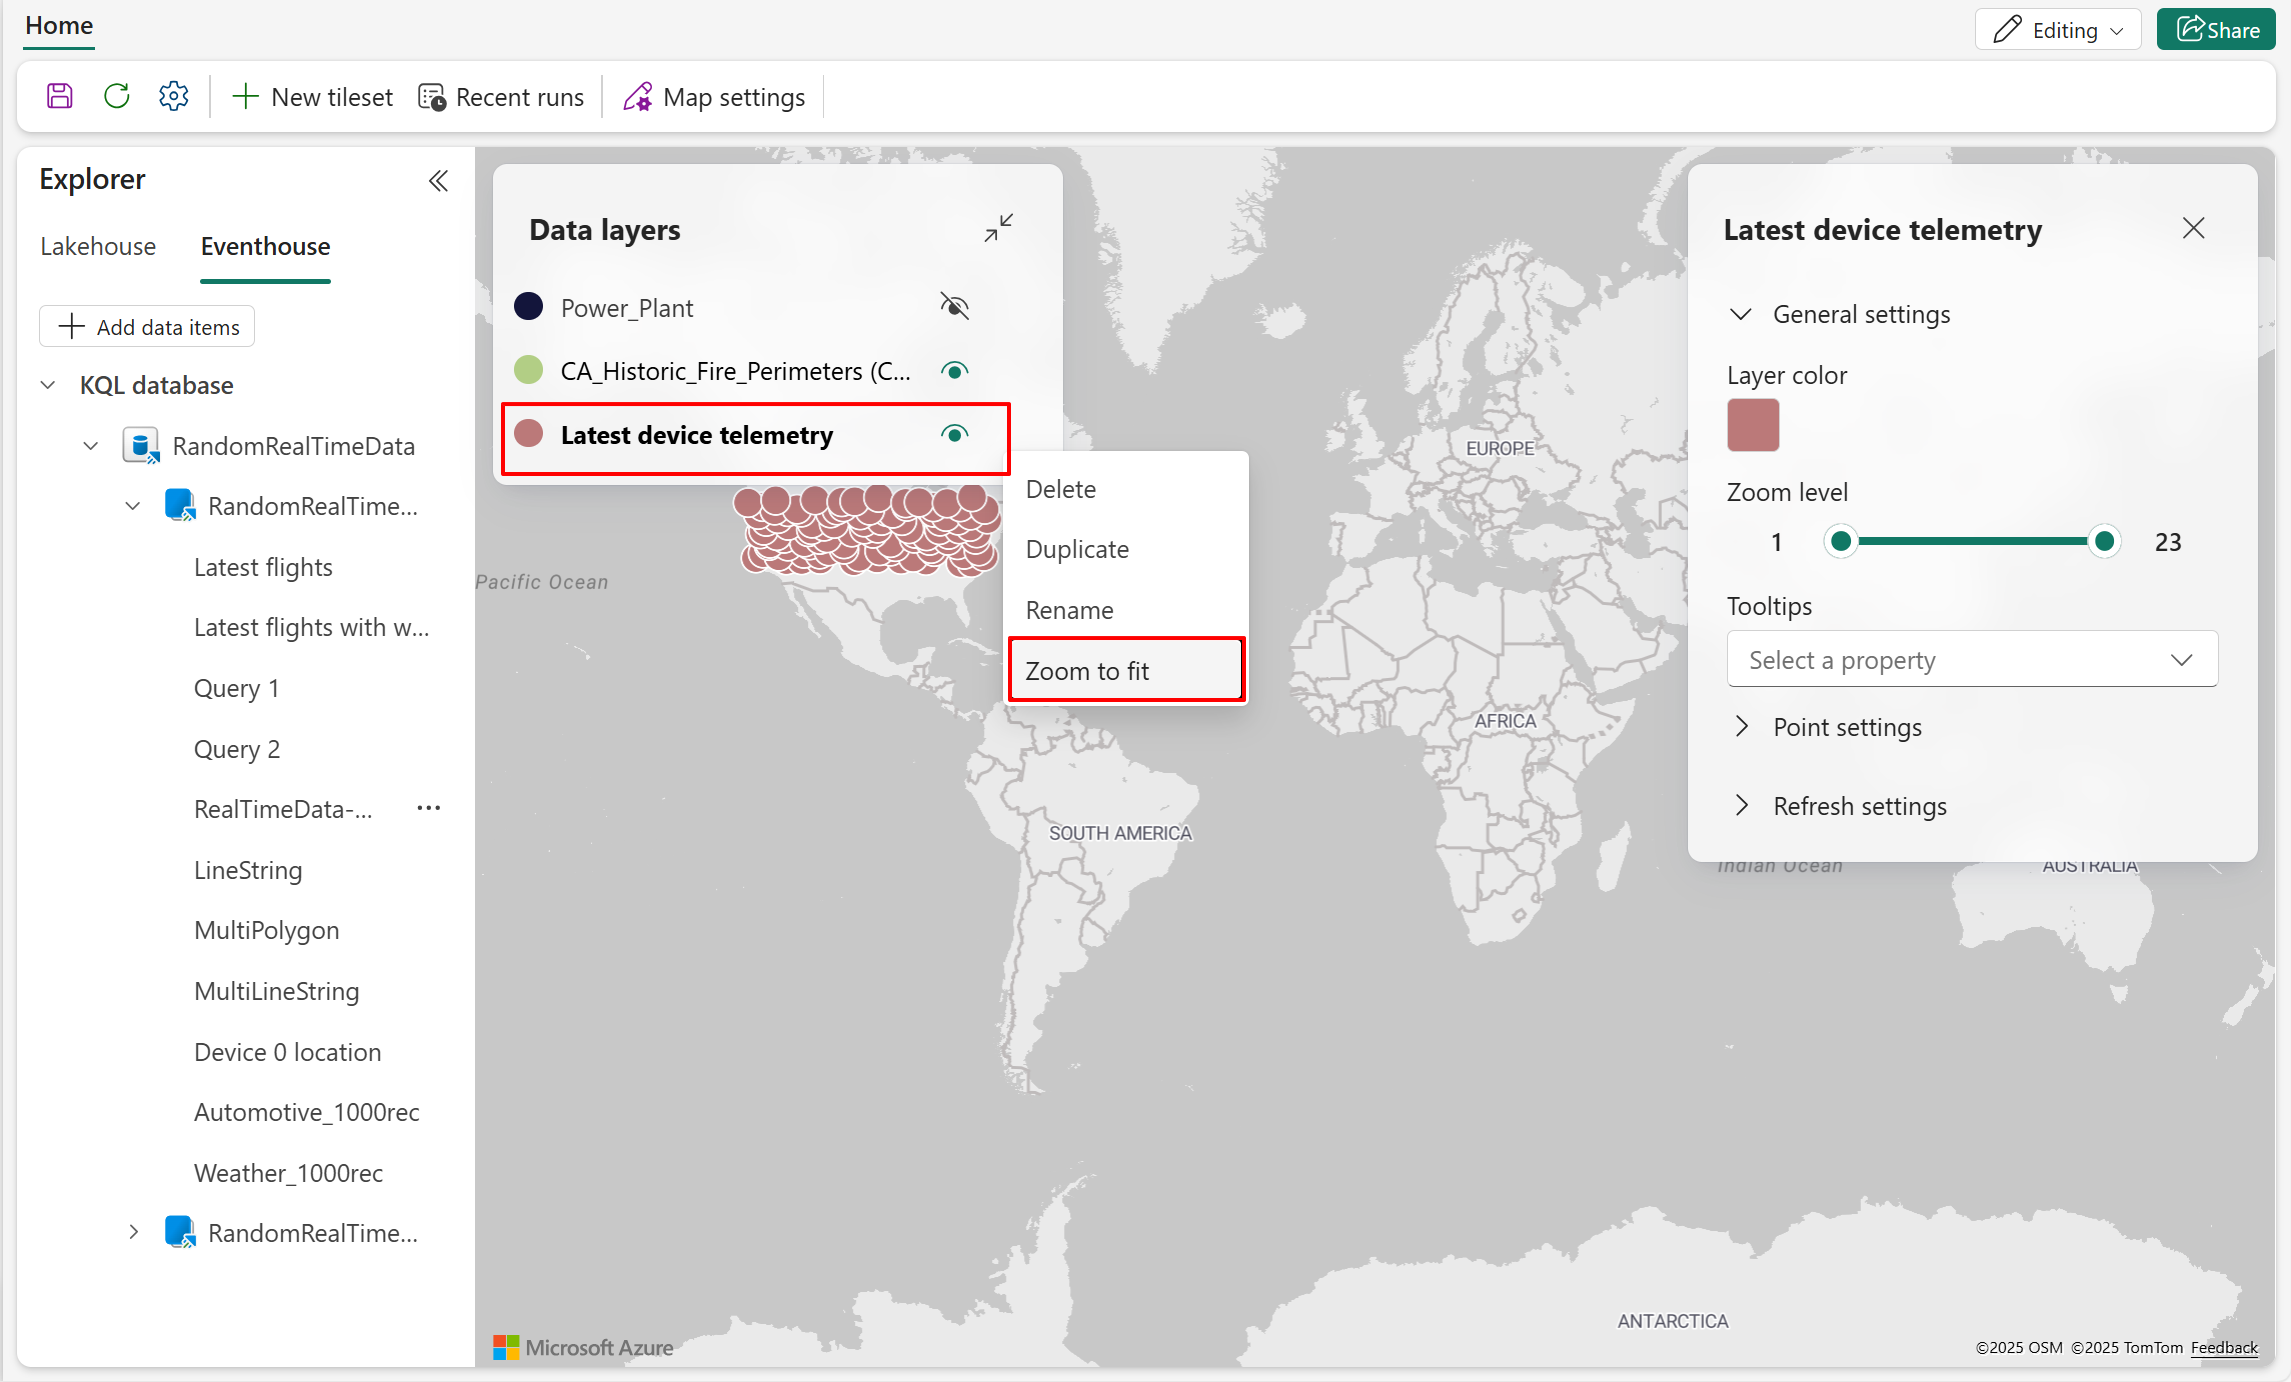
- The map is now zoomed in, enabling you to visually inspect the data with improved readability.

- The query refresh interval enables you to visualize changes in real-time as shown in the following screenshot.

- Select the Save button in the upper left side of the screen to save all of the map changes.


Data layer management
When managing multiple data layers on a map, maintaining organization is key to creating clear and effective visualizations. The Data layer pane provides essential tools to help you manage layers efficiently, including options to Reorder, Rename, Delete, and Duplicate. The following section outlines best practices for layer management, supporting the creation of clean, maintainable, and insightful spatial visualizations.
Show or hide data layer
- Show the data layer.
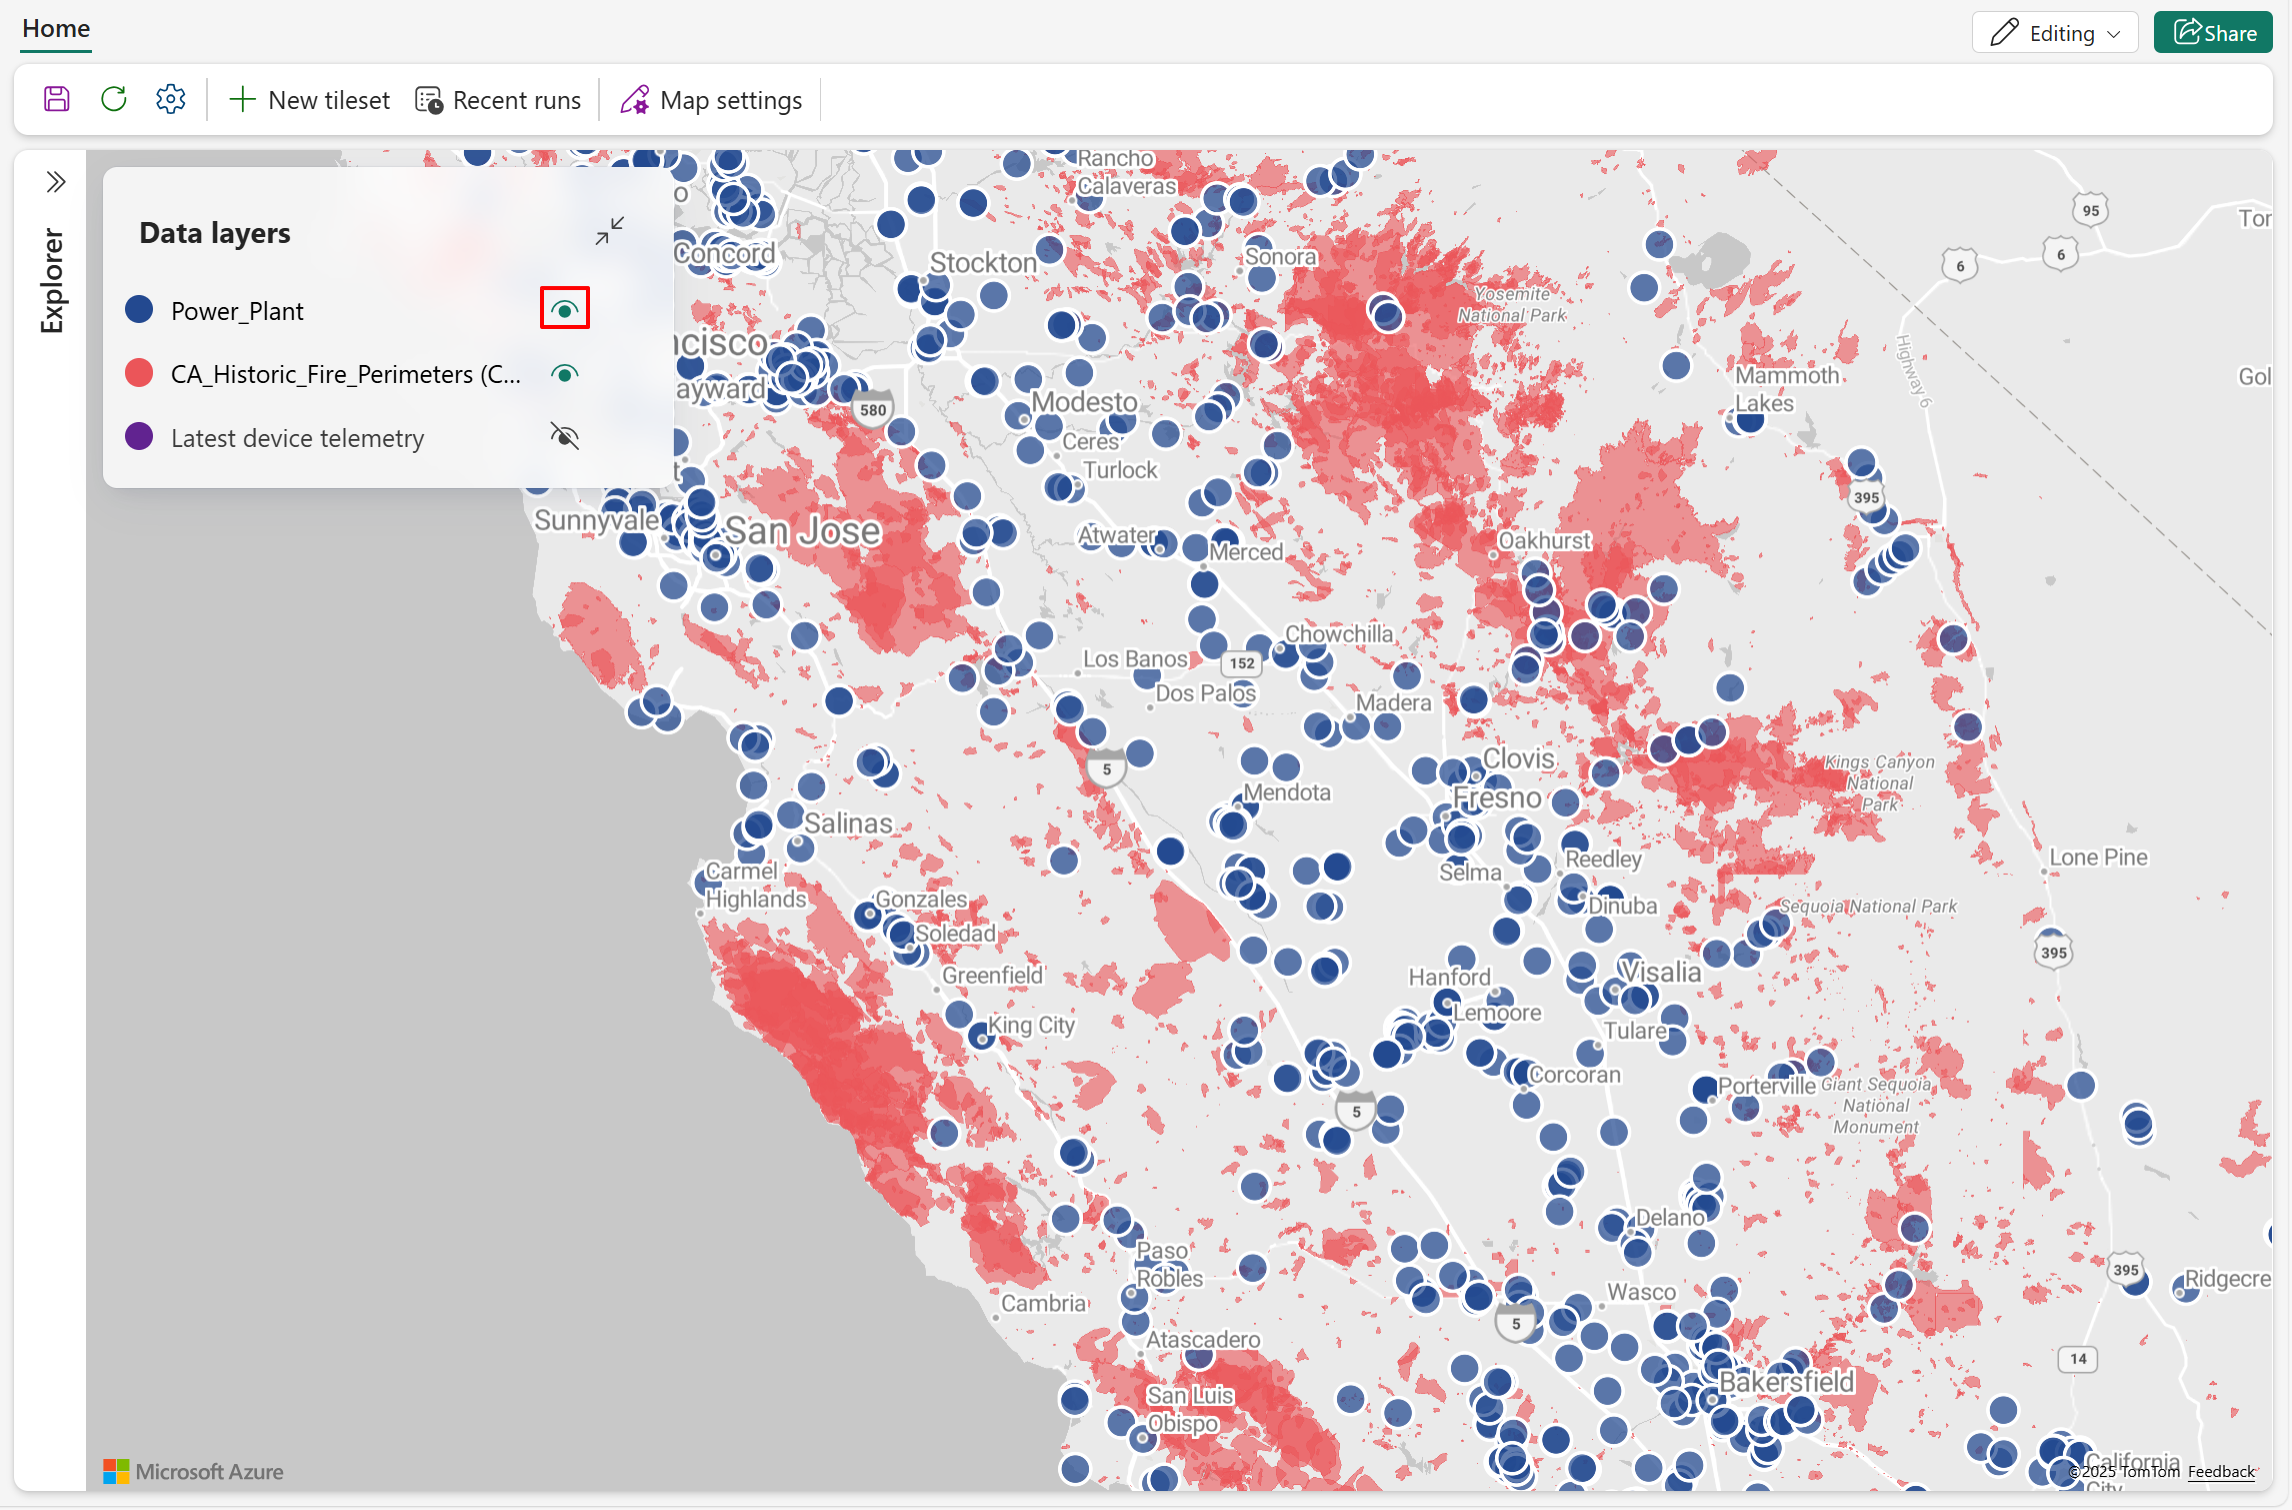
- Hide the data layer.


Reorder data layer
Drag a data layer to change its display order relative to other layers on the map.
The following screenshot demonstrates how to reorder data layers. To improve visual clarity in overlapping areas, move the Power Plant layer to the topmost position on the map. Placing layers based on point geometries above layers based on polygon geometries makes them easier to observe and interpret within the spatial visualization.

Rename data layer
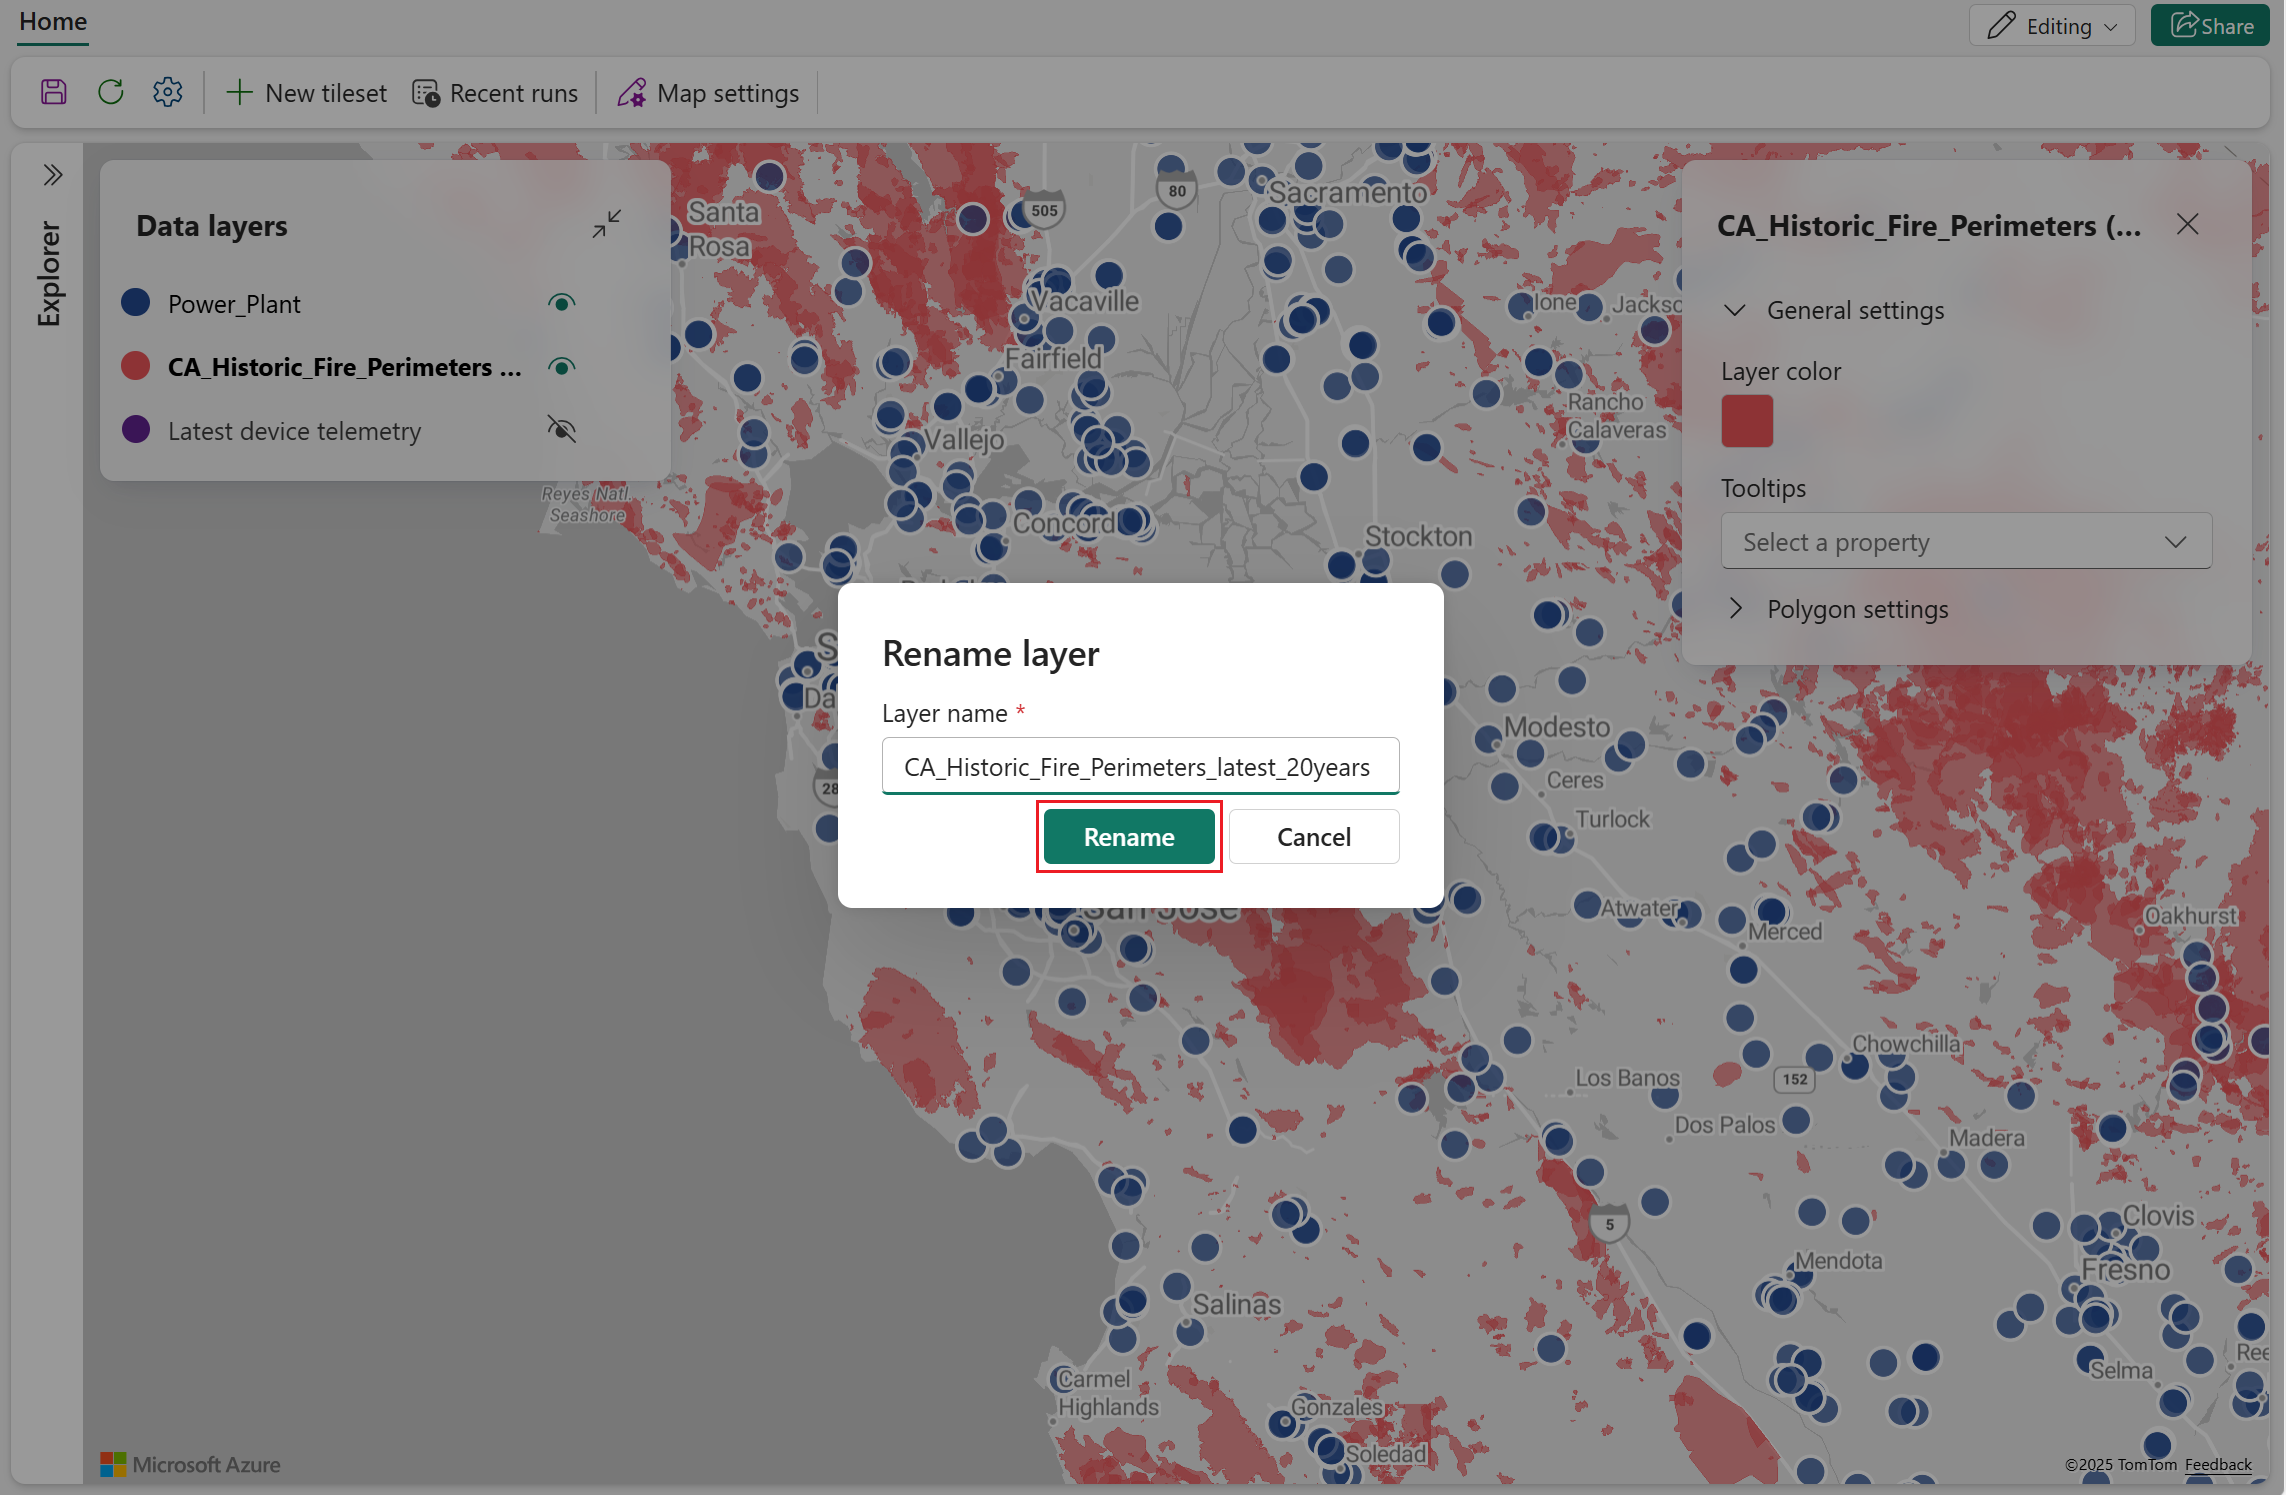
By default the name of the data layer is the name of the query it was created from. You can change the name at the time of creation, and can also change it at any point after. The following steps show how to change the name of an existing data layer.
- Select the data layer to rename, then select Rename in the popup menu.

- Enter the new name, then select Rename.


Duplicate data layer
A new data layer can be created by duplicating an existing one. After duplication, customize the layer's name and settings to highlight specific data dimensions or attributes.
Note
Enabling Clustering while duplicating data layers applies clustering effects to both layers, as they reference the same dataset.
- Choose the data layer you want to copy, then select Duplicate in the popup menu.

- A new data layer is created with the same settings as the original, except the name includes "(copy)" to indicate duplication.


Zoom to fit
Zoom to fit centers the map view on the selected data layer and adjusts it to display the full extent of that layer, making it easier to locate and explore spatial data.
- Choose the data layer you want to view, then select Zoom to fit in the popup menu.
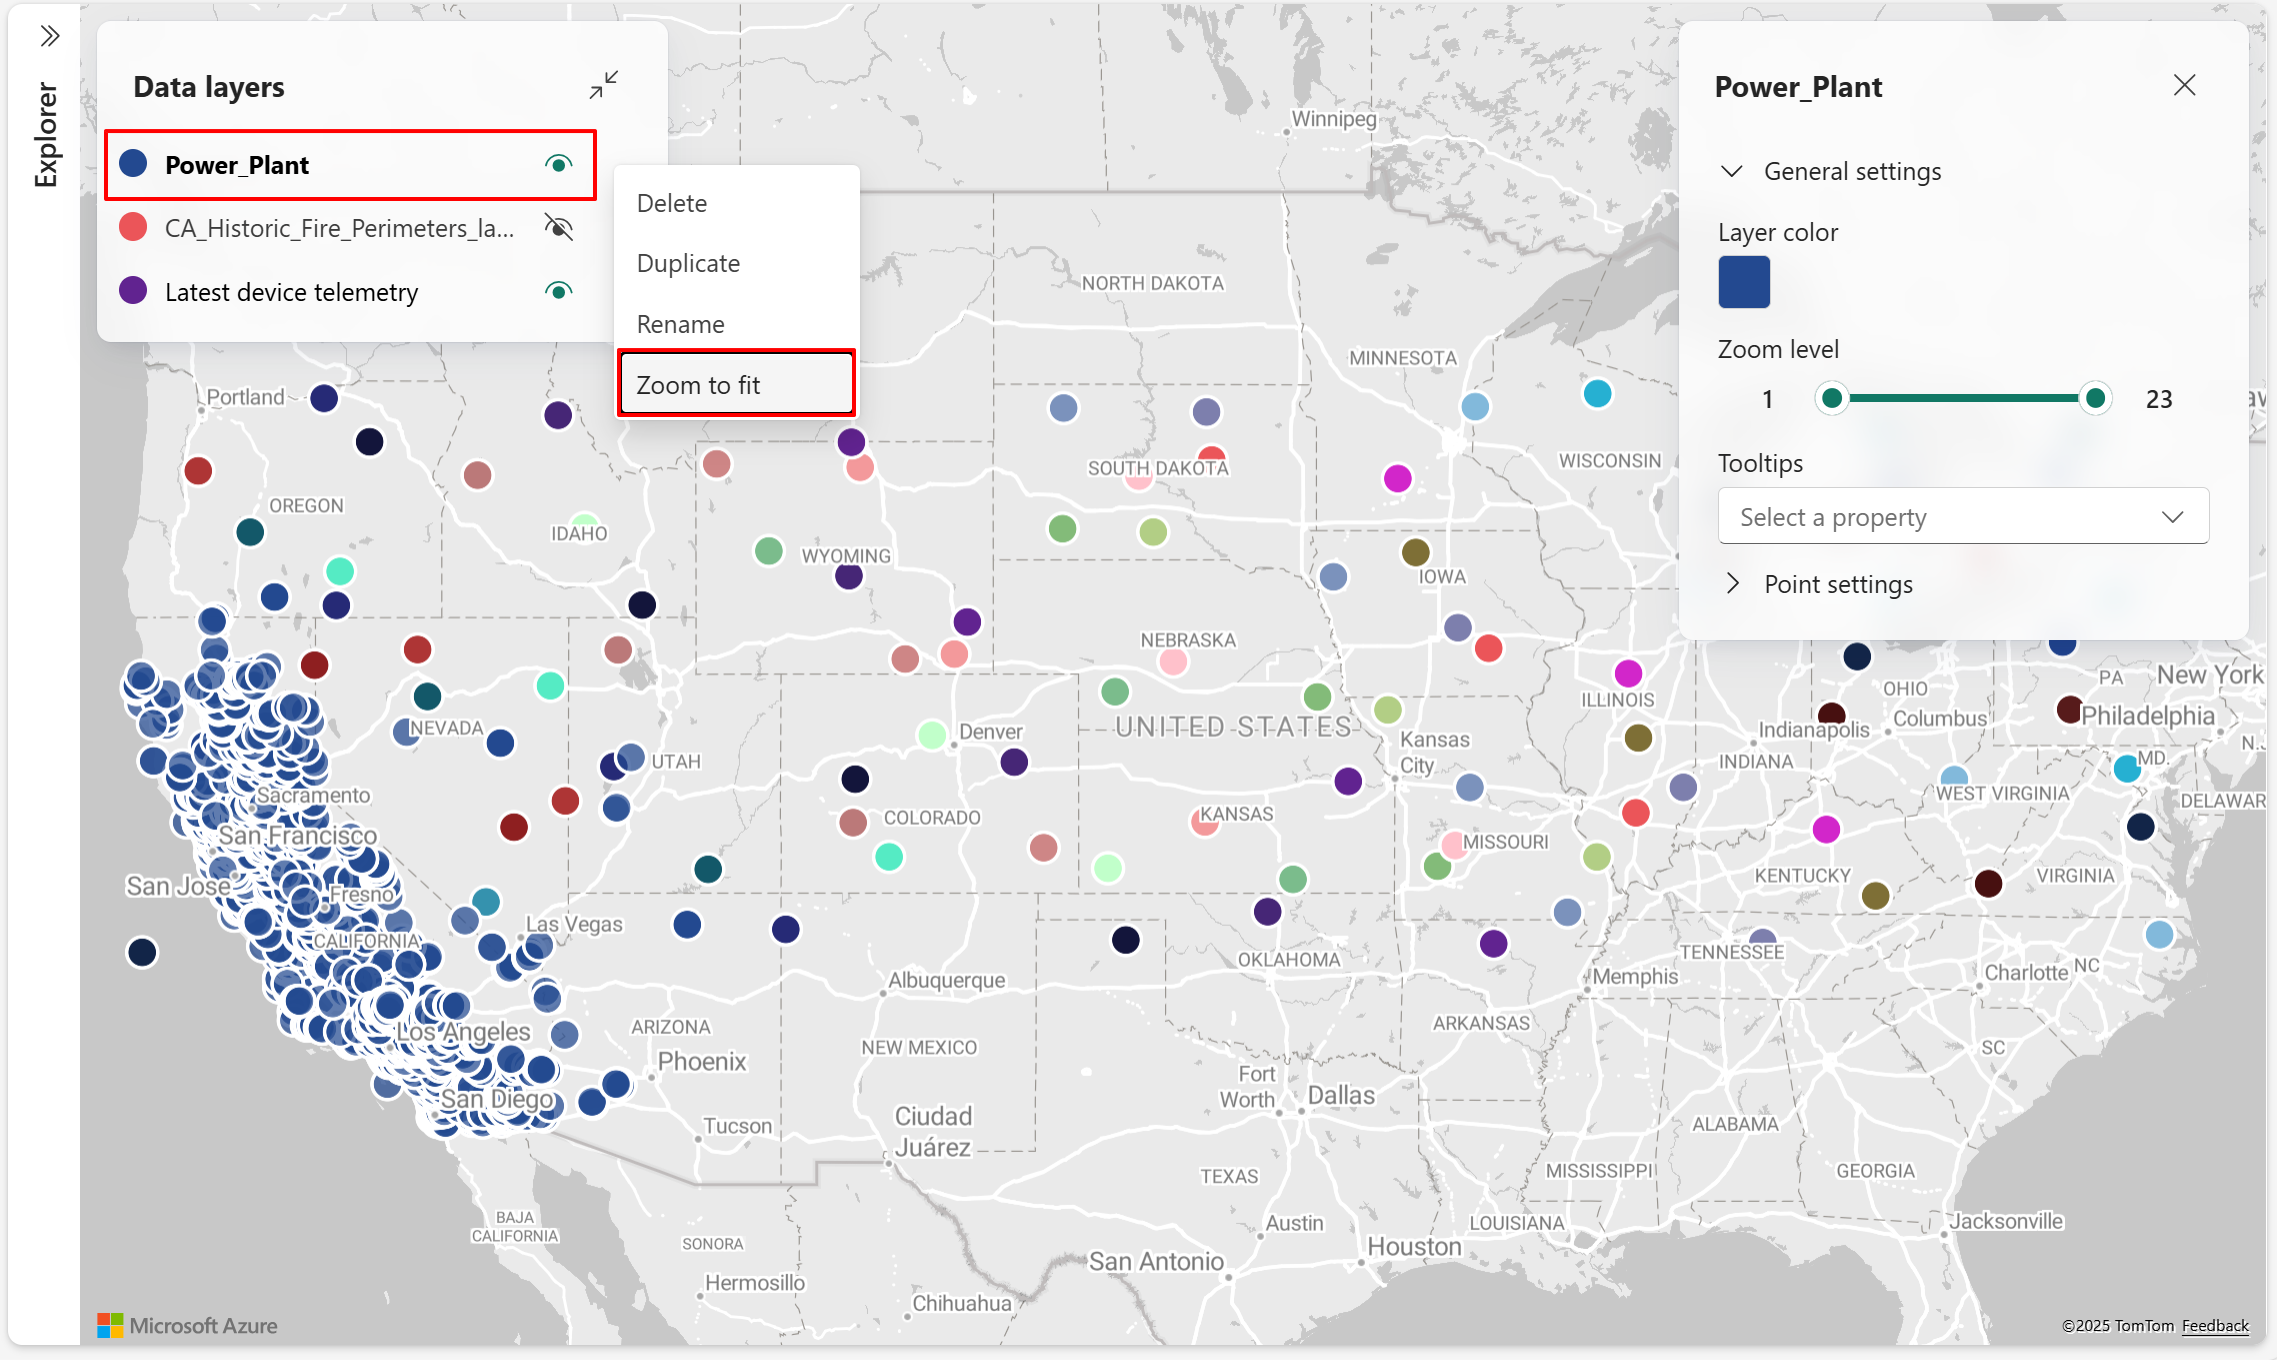
- The map view centers on the selected data layer and adjusts to display its full spatial extent.


Note
Zoom to fit is unavailable for PMTiles when bounds information is missing.
Delete data layer
Delete a data layer when you need to permanently remove it from the map. The following steps show how to delete an existing data layer.
Choose the data layer you want to remove from the map, then select Delete in the popup menu.

The layer is removed from both the map and the Data layers list.


