Note
Access to this page requires authorization. You can try signing in or changing directories.
Access to this page requires authorization. You can try changing directories.
Applies to: ✅ Microsoft Fabric ✅ Azure Data Explorer ✅ Azure Monitor ✅ Microsoft Sentinel
Applies the Fast Fourier Transform (FFT) on a series.
The series_fft() function takes a series of complex numbers in the time/spatial ___domain and transforms it to the frequency ___domain using the Fast Fourier Transform. The transformed complex series represents the magnitude and phase of the frequencies appearing in the original series. Use the complementary function series_ifft to transform from the frequency ___domain back to the time/spatial ___domain.
Syntax
series_fft(x_real [, x_imaginary])
Learn more about syntax conventions.
Parameters
| Name | Type | Required | Description |
|---|---|---|---|
| x_real | dynamic |
✔️ | A numeric array representing the real component of the series to transform. |
| x_imaginary | dynamic |
A similar array representing the imaginary component of the series. This parameter should only be specified if the input series contains complex numbers. |
Returns
The function returns the complex inverse fft in two series. The first series for the real component and the second one for the imaginary component.
Example
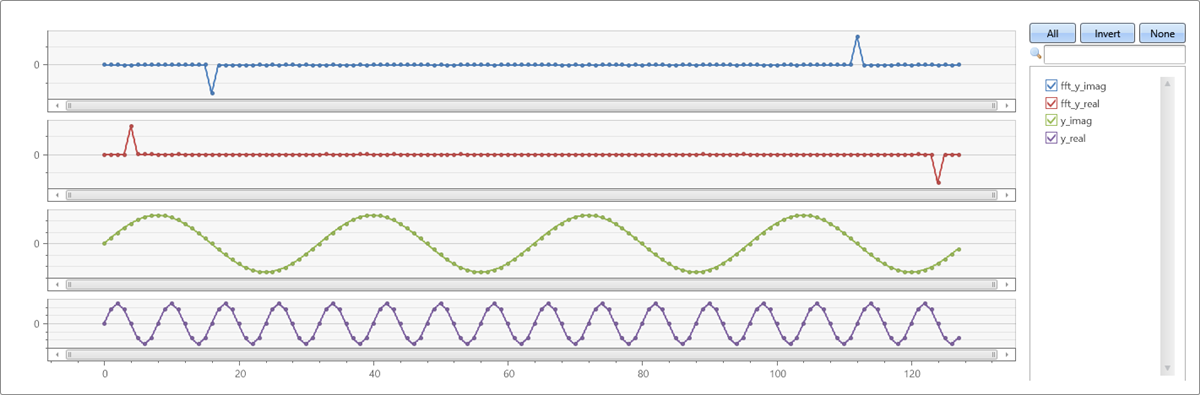
Generate a complex series, where the real and imaginary components are pure sine waves in different frequencies. Use FFT to transform it to the frequency ___domain:
let sinewave=(x:double, period:double, gain:double=1.0, phase:double=0.0)
{
    gain*sin(2*pi()/period*(x+phase))
}
;
let n=128;      //  signal length
range x from 0 to n-1 step 1 | extend yr=sinewave(x, 8), yi=sinewave(x, 32)
| summarize x=make_list(x), y_real=make_list(yr), y_imag=make_list(yi)
| extend (fft_y_real, fft_y_imag) = series_fft(y_real, y_imag)
| render linechart with(ysplit=panels)
This query returns fft_y_real and fft_y_imag:
Transform a series to the frequency ___domain, and then apply the inverse transform to get back the original series:
let sinewave=(x:double, period:double, gain:double=1.0, phase:double=0.0)
{
    gain*sin(2*pi()/period*(x+phase))
}
;
let n=128;      //  signal length
range x from 0 to n-1 step 1 | extend yr=sinewave(x, 8), yi=sinewave(x, 32)
| summarize x=make_list(x), y_real=make_list(yr), y_imag=make_list(yi)
| extend (fft_y_real, fft_y_imag) = series_fft(y_real, y_imag)
| extend (y_real2, y_image2) = series_ifft(fft_y_real, fft_y_imag)
| project-away fft_y_real, fft_y_imag   //  too many series for linechart with panels
| render linechart with(ysplit=panels)
This query returns y_real2 and *y_imag2, which are the same as y_real and y_imag:
