Developer Portal for Microsoft Teams provides a comprehensive suite of tools to help you analyze and understand your app's and agent's performance and user engagement. By using these analytics, you can gain valuable insights into how users interact with your app and agent, identify areas for improvement, and make data-driven decisions to enhance the overall user experience.
Whether you're tracking active users, retention rates, or usage patterns across different platforms, Developer Portal helps you with the information you need to optimize your app and ensure its success. Custom apps built for your org (LOB apps) can access app and agent usage data only for Teams. However, for third-party apps you can explore new Microsoft 365 dimensions, such as host product and capabilities.
The app and agent usage for a given day is reflected within 24 to 48 hours, and usage data for the new apps or agents can take up to three to five days to reflect in the charts.
Prerequisite
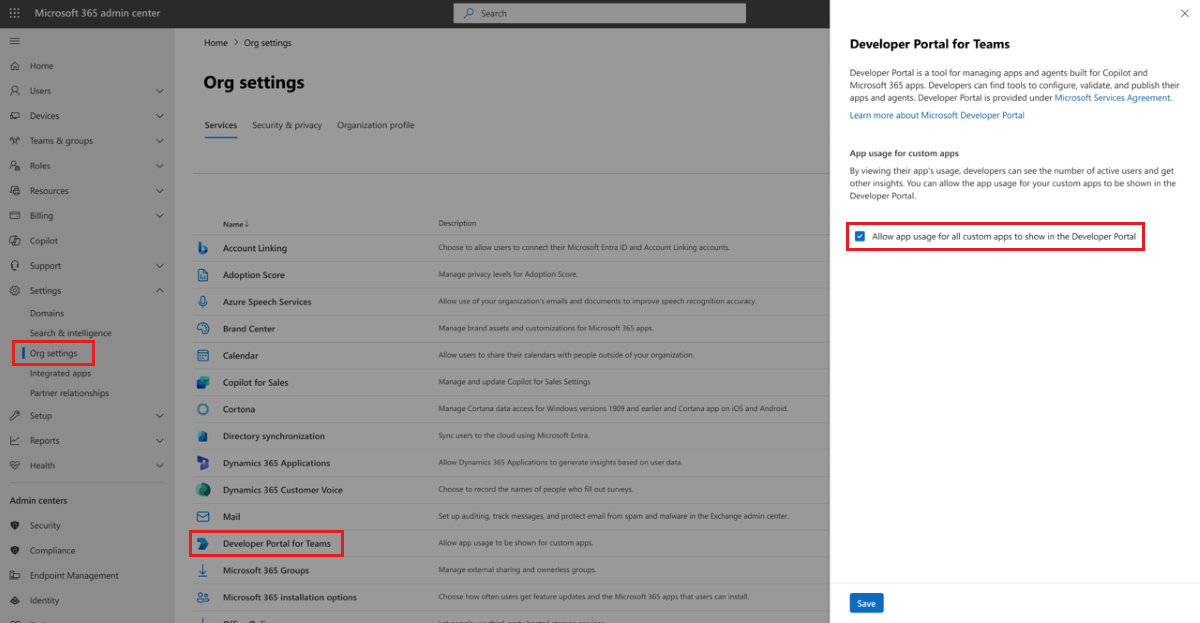
To analyze custom app usage, your tenant admin (a global administrator or a Teams administrator) must allow app and agent usage data for custom apps to be shown in Developer Portal. To allow app and agent usage:
- Go to Microsoft 365 admin center.
- Navigate to Settings > Org settings > Services > Developer Portal for Teams.
- Select Allow app usage for all custom apps to show in the Developer Portal.
For more information, see enable developers to use app analytics.
Get started
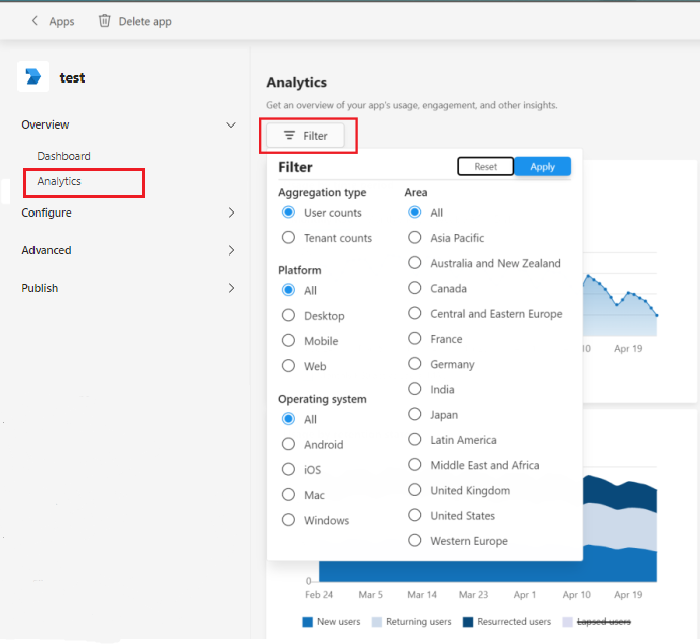
You can view your custom app's usage and other insights from the Analytics page. To access the page:
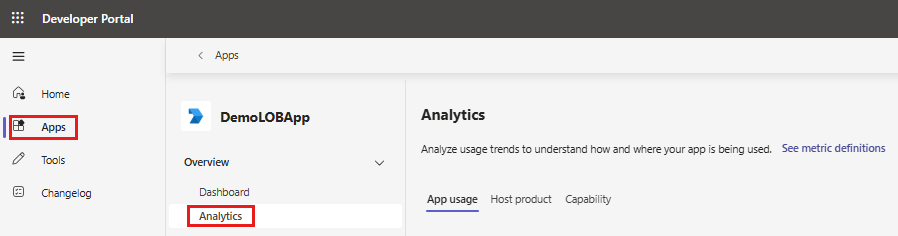
- Go to Developer Portal.
- Select Apps from the left pane.
- Select the required app from the Apps page.
- Select Analytics under the Overview section.
Note
You can also access the Active Users card directly from the Dashboard.
Metric definitions
| Metric |
Definition |
| Monthly active users (MAU) |
Number of unique users who performed an intentional activity with your app and agent within that rolling 28 days window in UTC. |
| Weekly active users (WAU) |
Number of unique users who performed an intentional activity with your app and agent within that rolling seven days window in UTC. |
| Daily active users (DAU) |
Number of unique users who performed an intentional activity with your app and agent in a given day in UTC. |
| Monthly active tenants |
Number of unique tenants who performed an intentional activity with your app and agent within that rolling 28 days window in UTC. |
| Weekly active tenants |
Number of unique tenants who performed an intentional activity with your app and agent within that rolling seven days window in UTC. |
| Daily active tenants |
Number of unique tenants who performed an intentional activity with your app and agent in a given day in UTC. |
Tip
To know more about each metric definition, select See metric definitions. A pop-up window appears on the right-side of the window with the required definitions.
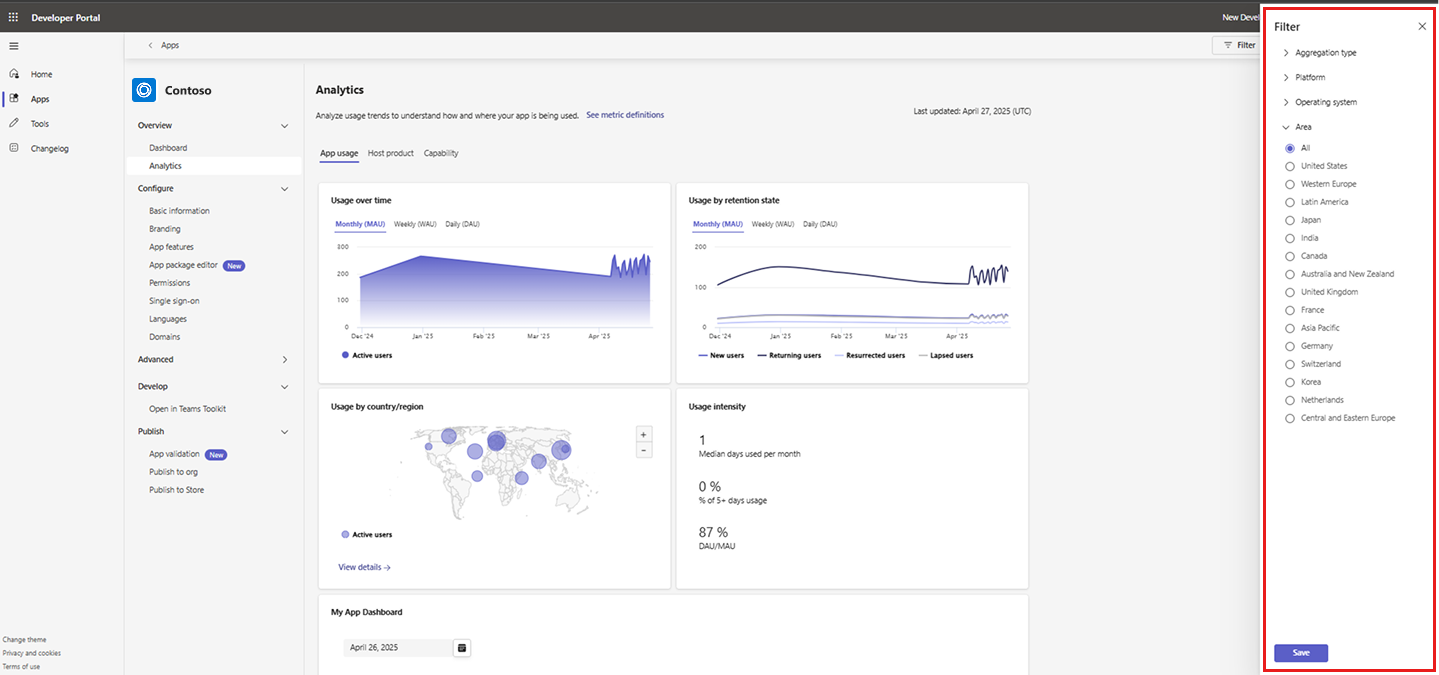
As you explore individual metrics on this page, you can use the Filter button to analyze your app's and agent's usage from the following filter options:
- Aggregation type: Allows you to view active users or active tenants.
- Platform: Allows you to group the metrics by the platform on which users performed intentional activities with your app and agent. The platform can be Desktop, Mobile, Web, or other available options.
- Operating system: Allows you to group the metrics by the operating system on which users performed intentional activities with your app and agent. The operating system can be Windows, Mac, iOS, Android or other available options.
- Area: Allows you to group the metrics by the geographical ___location of the active usage.
App and agent analytics
To gain insights on the app and agent usage and analyze trends, explore the following three sections under Analytics:
App and agent usage
The App usage tab shows the following metrics to help you track engagement and user behavior:
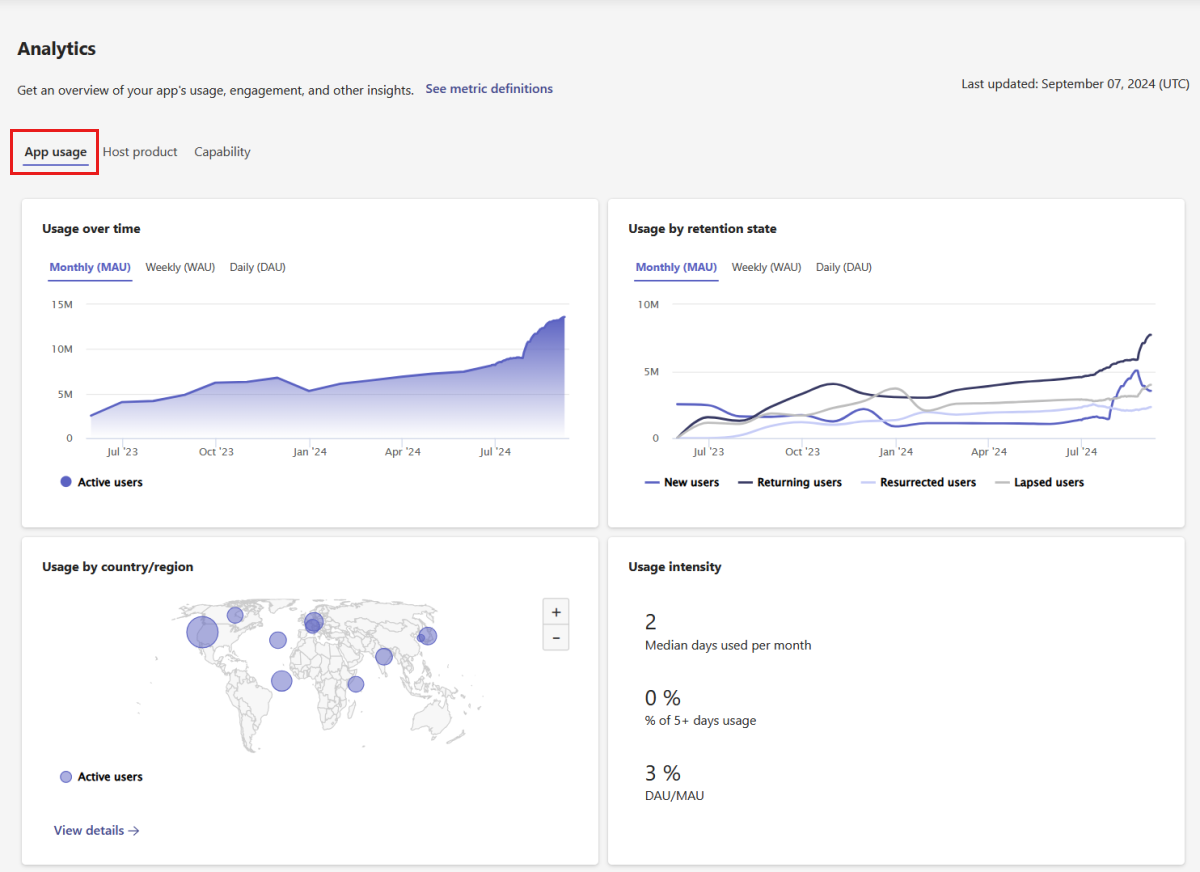
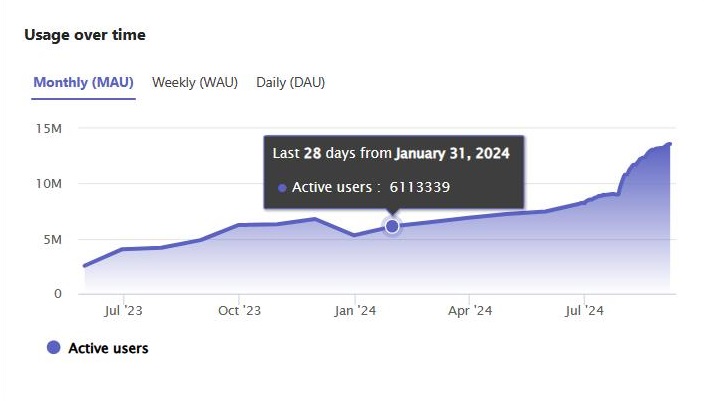
Usage over time
The Usage over time chart shows the number of active users or tenants who opened and used your app and agent across different time periods.
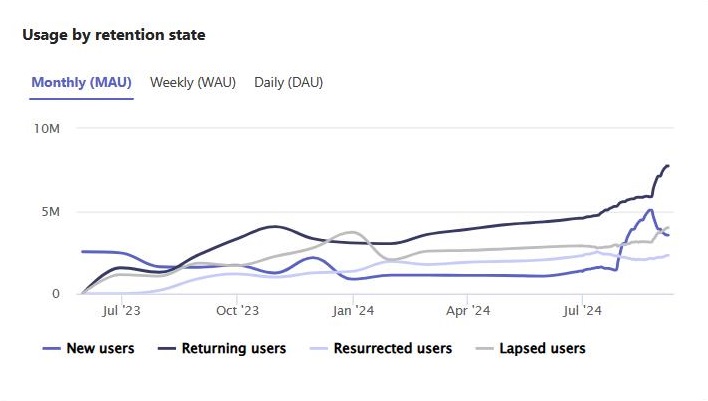
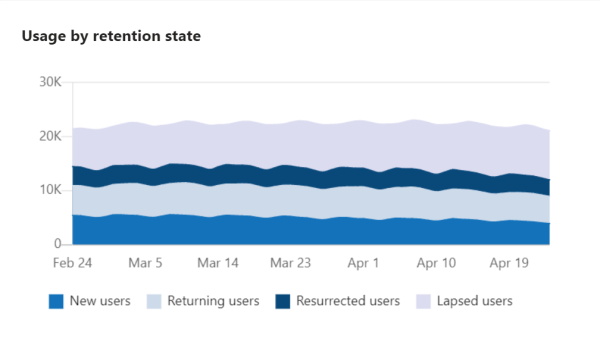
Usage by retention state
The Usage by retention state chart allows you to track four key retention or churn metrics for your app and agent over time.
| Metric |
Definition |
| New users |
Active users who used your app and agent for the first time in the current time period. |
| Returning users |
Active users who used your app and agent during the current period and in the immediately preceding period. |
| Resurrected users |
Active users who started using your app and agent again in the current period, after a previous period of inactivity. |
| Lapsed users |
Active users who stopped using your app and agent in the current period, after a previous period of activity. |
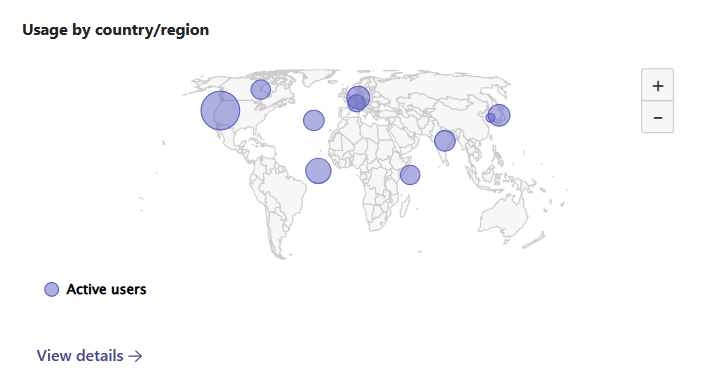
Usage by country or region
The Usage by country/region chart shows the various regions where your app and agent are being used. Each user is mapped to a single area or geography. You can select View details for more information on active users in different countries or regions.
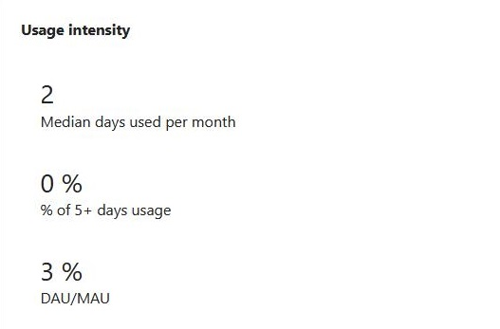
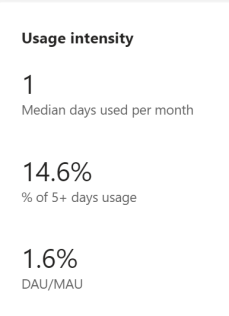
Usage intensity
The Usage intensity chart shows frequency and depth of use. They're one indicator that users are finding value in continuing to use your app and agent.
| Metric |
Definition |
| Median days used per month |
Median number of days in which your app and agent was opened in the last month. |
| % of 5+ days usage |
Percentage of active users who opened or used your app and agent more than five days in the last month. |
| DAU/MAU |
Average number of daily active users (DAU) divided by monthly active users (MAU) for a rolling 30-day time period. |
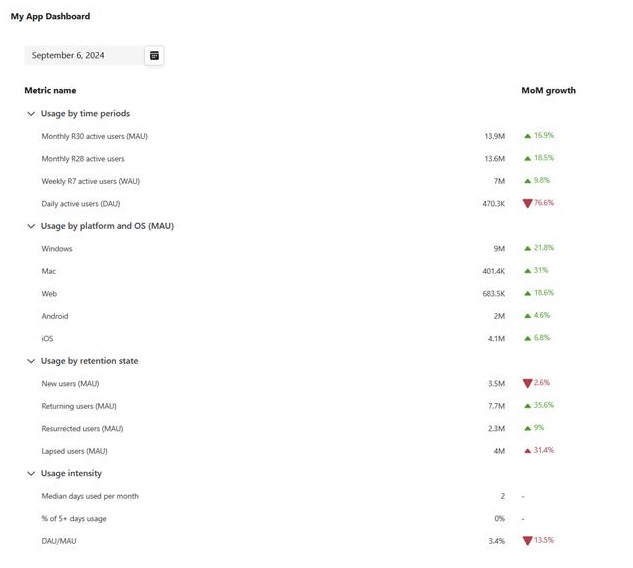
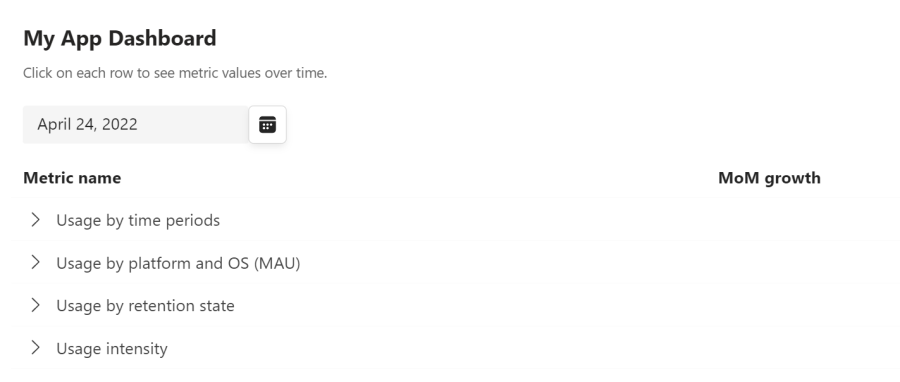
App dashboard
The My App Dashboard table shows the latest R30 (Rolling 30 days) data for each of the metrics under the previous four categories, and the Month over Month (MoM) change. Use the time picker on the upper left side and select the desired date to view the following:
- Select any day in the last 75 days to view daily R30 data.
- Select any end of month in the last 12 months to view R30 data.
You can select each of these metric names to see trends over time.
Host product
The Host product tab shows the following usage analytics for app and agent:
The first two scorecards display metrics such as the host with the most active users and the operating system (OS) with the most active users based on monthly, weekly, and daily data.
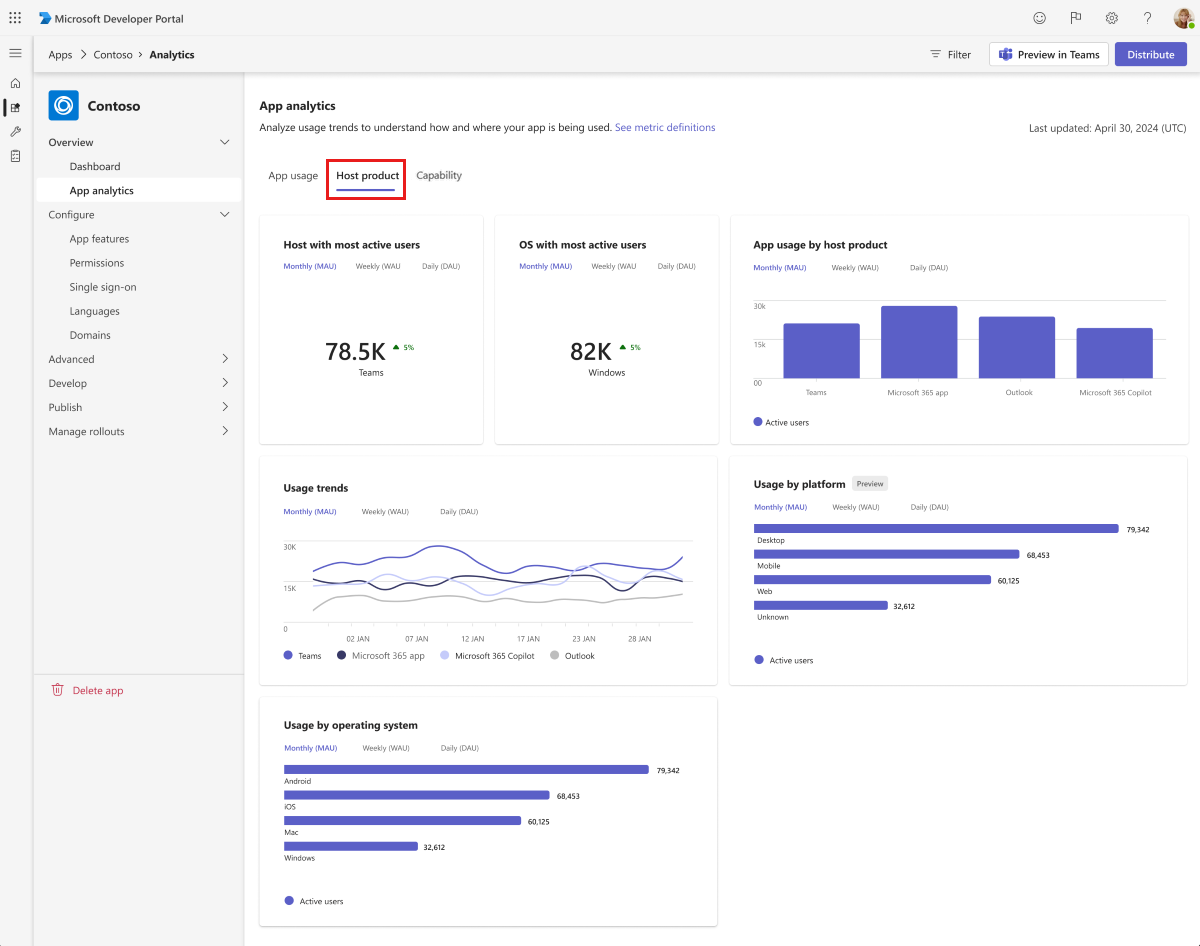
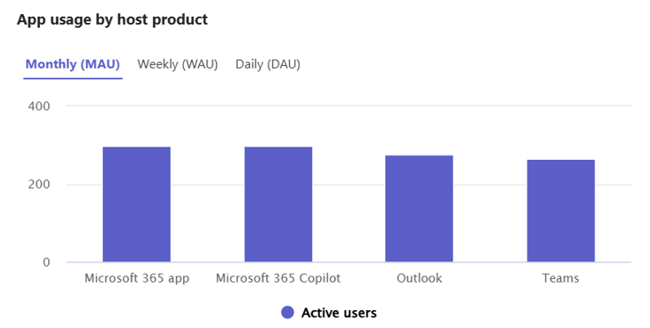
App and agent usage by host product
The App usage by host product chart shows your app's and agent's active usage across various host products, including Microsoft 365 app, Microsoft 365 Copilot, Outlook, and Teams.
The Usage by platform chart shows your app's and agent's active usage across various platforms, such as Desktop, Mobile, Web, and other platforms where the app and agent are used.
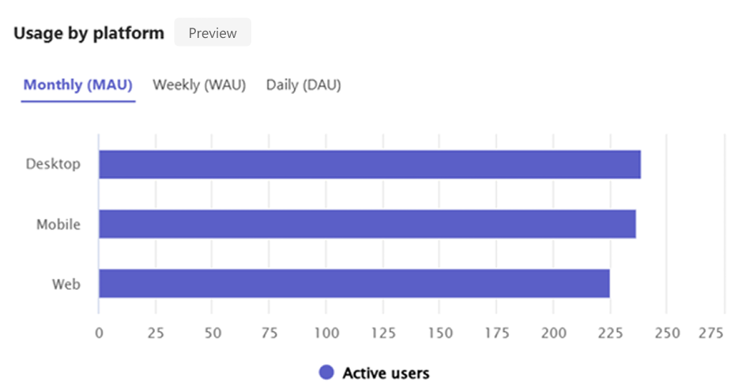
Note
The Preview tag indicates that the metric Usage by host product is in its initial phase and might undergo modifications as we collect feedback and continue to improve the experience.
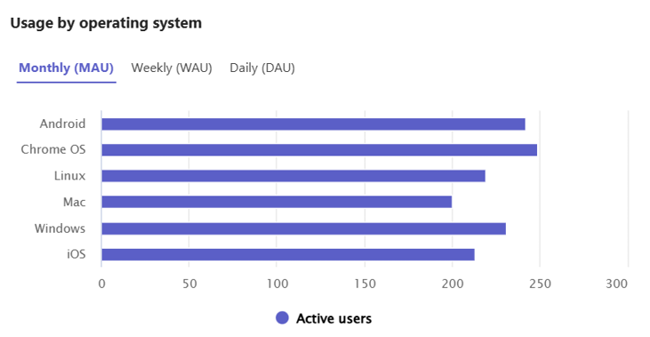
Usage by operating system
The Usage by operating system chart shows your app's or agent's active usage across various operating systems, such as Android, Chrome OS, Linux, Mac, Windows, and iOS of monthly, weekly, and daily data.
Capability
The Capability tab shows the usage of individual app and agent capabilities that you've configured within your app. This page summarizes the overall usage of the following app and agent capabilities in different host products.
Note
- The current custom app analytics is deprecating soon.
- You can opt for the new custom app and agent analytics in Developer Portal by selecting the banner on the Analytics page. For more information, see new custom app and agent analytics.
Get started
You can view your custom app's usage and other insights from the Analytics page. To access the page:
Go to Developer Portal.
Select Apps from the left pane.
Select the required app from the Apps page.
Select Analytics under the Overview section or select View details under the Active Users (Preview) card.

Metric definitions
| Metric |
Definition |
| Monthly R30 active users (MAU) |
The default usage metric. It shows the count of unique active users who used your app within that rolling 30 days window in UTC. |
| Daily active users (DAU) |
It shows the count of unique active users who used your app in a given day in UTC. |
| Weekly R7 |
It shows the count of unique active users who used your app within that rolling seven days window in UTC. |
As you explore individual metrics on this page, you can use the Filter button to analyze your app's usage from the following filter options:
Aggregation type: Allows you to group the metrics by active users or active tenants.
Platform: Allows you to group the metrics by the platform on which users performed intentional activities with your app. The platform can be desktop, mobile, or web.
Operating system: Allows you to group the metrics by the operating system on which users performed intentional activities with your app.
Area: Allows you to group the metrics by the geographical ___location of the active usage.
App usage
After you select your desired filters, you can explore the following individual widgets:
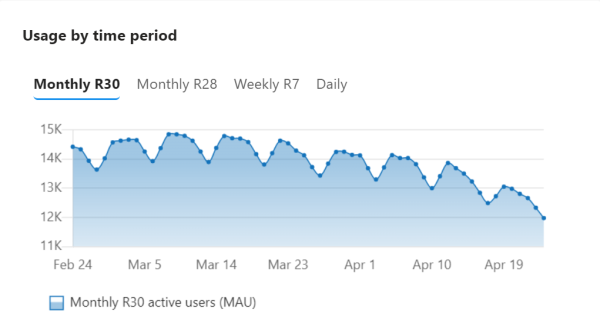
Usage by time period
The Usage by time period chart shows the number of active users or tenants who opened and used your app across different time periods.
| Metric |
Definition |
| Monthly R30 |
Each data point represents a given R30 (Rolling 30 days) period. |
| Monthly R28 |
Each data point represents a given R28 (Rolling 28 days) period. |
| Weekly R7 |
Each data point represents a given R7 (Rolling seven days) period. |
| Daily |
Each data point represents a given R1 (Rolling one day) period. |
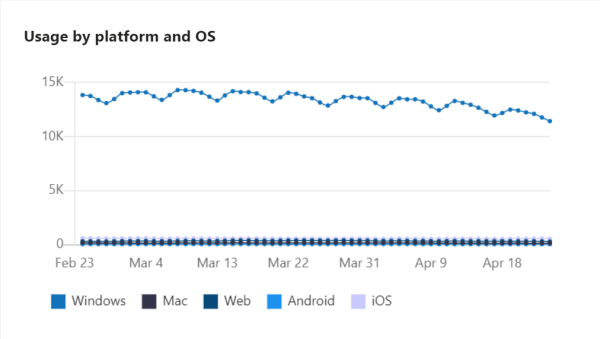
The Usage by platform and OS chart shows your app's active usage across various endpoints, such as Windows, Mac, iOS, Android, and Web. The same user or tenant can use an app on multiple endpoints. Each data point represents a given R30 (Rolling 30 days) period.
Usage by retention state
The Usage by retention state chart allows you to track four key retention or churn metrics for your app over time.
| Metric |
Definition |
| New users or tenants |
Active users or tenants who are new and haven't used your app. |
| Returning users or tenants |
Active users or tenants who used your app during a given R30 (Rolling 30 days) time period and the immediately preceding R30 time period. |
| Resurrected users or tenants |
Active users or tenants who used your app one or more times before but not in the immediately preceding R30 time period. |
| Lapsed users or tenants |
Active users or tenants who weren't seen during a given R30 time period but were seen during the immediately preceding R30 time period. |
Usage intensity
The Usage intensity chart shows the key usage intensity metrics for your app.
| Metric |
Definition |
| Median days used per month |
The median number of days in which your app was opened in the last R30 (Rolling 30 days) time period. |
| % of 5+ Days usage |
The percentage of active users who opened or used the app more than five days in the last R30 time period. |
| DAU/MAU |
The ratio of the average number of unique users or tenants who used your app on each day divided by the Monthly active users for the selected R30 time period. |
App dashboard
The My App dashboard table shows the latest R30 (Rolling 30 days) data for each of the metrics under the previous four categories, and the Month over Month change. Use the time picker on the upper right side and select the desired date to view the following:
- Daily R30 data for the last 75 days.
- End of month R30 data for up to 12 months.
You can select each of these Metric name to see trends over time.
To view app and agent usage in Developer Portal, you need Manager or Developer role in Partner Center. The marketplace account owner or manager can assign user roles and permissions.
You can view the app or agent usage for your third-party app and other insights from the Analytics page. To access the page:
- Go to Developer Portal.
- Select Apps from the left pane.
- Select the required app from the Apps page.
- Select Analytics under the Overview section.
To learn how to import your published app into Developer Portal, see import an existing app.
Metric definitions
| Metric |
Definition |
| Monthly active users (MAU) |
Number of unique users who performed an intentional activity with your app and agent within that rolling 28 days window in UTC. |
| Weekly active users (WAU) |
Number of unique users who performed an intentional activity with your app and agent within that rolling seven days window in UTC. |
| Daily active users (DAU) |
Number of unique users who performed an intentional activity with your app and agent in a given day in UTC. |
| Monthly active tenants |
Number of unique tenants who performed an intentional activity with your app and agent within that rolling 28 days window in UTC. |
| Weekly active tenants |
Number of unique tenants who performed an intentional activity with your app and agent within that rolling seven days window in UTC. |
| Daily active tenants |
Number of unique tenants who performed an intentional activity with your app and agent in a given day in UTC. |
Tip
To know more about each metric definition, select See metric definitions. A pop-up window appears on the right-side of the window with the required definitions.
As you explore individual metrics on this page, you can use the Filter button to analyze your app's and agent's usage from the following filter options:
- Aggregation type: Allows you to view active users or active tenants.
- Platform: Allows you to group the metrics by the platform on which users performed intentional activities with your app and agent. The platform can be Desktop, Mobile, Web, or other available options.
- Operating system: Allows you to group the metrics by the operating system on which users performed intentional activities with your app and agent. The operating system can be Windows, Mac, iOS, Android or other available options.
- Area: Allows you to group the metrics by the geographical ___location of the active usage.
App and agent analytics
To gain insights on the app and agent usage and analyze trends, explore the following three sections under Analytics:
App and agent usage
The App usage tab shows the following metrics to help you track engagement and user behavior:
Usage over time
The Usage over time chart shows the number of active users or tenants who opened and used your app and agent across different time periods.
Usage by retention state
The Usage by retention state chart allows you to track four key retention or churn metrics for your app and agent over time.
| Metric |
Definition |
| New users or tenants |
Active users or tenants who are new and haven't used your app and agent. |
| Returning users or tenants |
Active users or tenants who used your app and agent during a given R28 (Rolling 28 days) time period and the immediately preceding R28 time period. |
| Resurrected users or tenants |
Active users or tenants who used your app and agent one or more times before but not in the immediately preceding R28 time period. |
| Lapsed users or tenants |
Active users or tenants who weren't seen during a given R28 time period but were seen during the immediately preceding R28 time period. |
Usage by country or region
The Usage by country/region chart shows the various regions where your app and agent are being used. You can select View details for more information on active users in different countries or regions.
Usage intensity
The Usage intensity chart shows frequency and depth of use. They're one indicator that users are finding value in continuing to use your app and agent.
| Metric |
Definition |
| Median days used per month |
Median number of days in which your app and agent was opened in the last R28 (Rolling 28 days) time period. |
| % of 5+ days usage |
Percentage of active users who opened or used the app and agent more than five days in the last R28 time period. |
| DAU/MAU |
Ratio of the average number of unique users or tenants who used your app and agent on each day divided by the monthly active users for the selected R28 time period. |
App dashboard
The My App Dashboard table shows the latest R30 (Rolling 30 days) data for each of the metrics under the previous four categories, and the Month over Month (MoM) change. Use the time picker on the upper left side and select the desired date to view the following:
- Daily R30 data for the last 75 days.
- End of month R30 data for up to 12 months.
You can select each of these metric names to see trends over time.
Host product
The Host product tab shows the following usage analytics for app and agent:
The Key Performance Indicator (KPI) cards display metrics such as the host with most active users and the operating system (OS) with most active users based on monthly, weekly, and daily data in a metric card format.
App and agent usage by host product
The App usage by host product chart shows your app's or agent's active usage across various host products, including Microsoft 365 app, Microsoft 365 Copilot, Outlook, and Teams.
The Usage by platform chart shows your app's and agent's active usage across various platforms, such as Desktop, Mobile, Web, and other platforms where the app or agent are used.
Note
The Preview tag indicates that the metric Usage by host product is in its initial phase and might undergo modifications as we collect feedback and continue to improve the experience.
Usage by operating system
The Usage by operating system chart shows your app's or agent's active usage across various operating systems, such as Android, Chrome OS, Linux, Mac, Windows, and iOS.
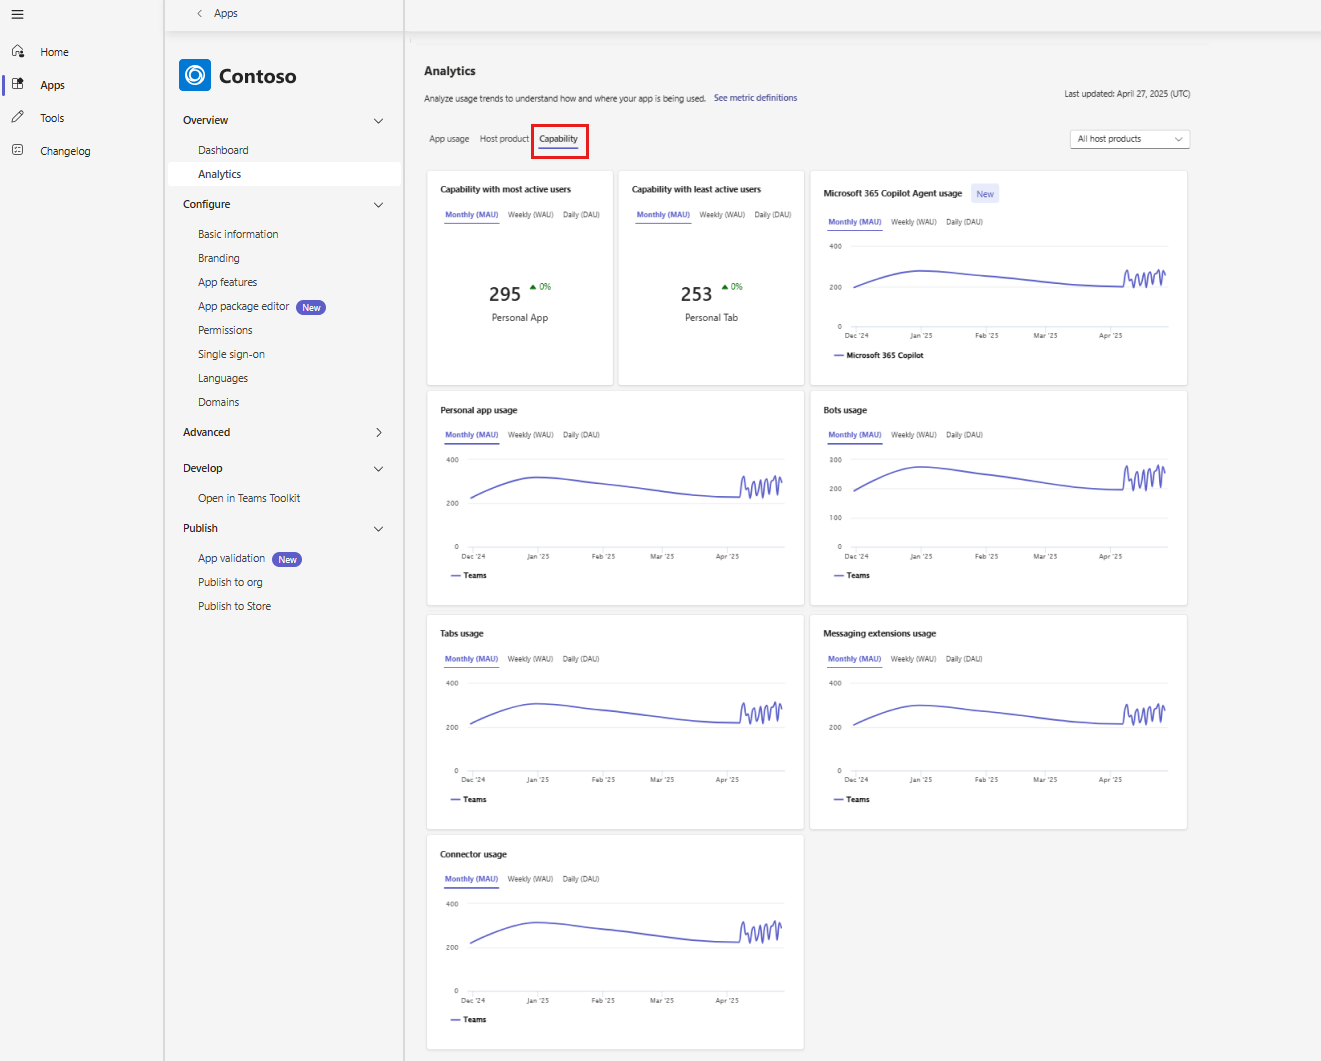
Capability
The Capability tab shows the usage of individual app and agent capabilities that you've configured within your app. This page summarizes the overall usage of the following app and agent capabilities in different host products:
- Microsoft 365 Copilot Agent
- Bots
- Tabs
- Message extension
- Personal app
- Connector
- Personal tab
Note
Microsoft 365 Copilot Agent includes usage of declarative agents only. The usage of custom engine agent is expected to be introduced later in Developer Portal.


