Note
Access to this page requires authorization. You can try signing in or changing directories.
Access to this page requires authorization. You can try changing directories.
Appropriate roles: Referrals admin
Note
You can access the Referrals analytics pages from both the Insights workspace and the Referrals workspace.
The Leads page under the Analytics section in Referrals lets you see how your referrals are performing. Review these metrics regularly to identify trends or areas that need attention, and start driving towards your business goals.
This dashboard displays metrics for Marketplace and Qualified leads in different tabs.
Navigating the leads insights dashboard
Leads insights dashboard have many page level features for improved user experience and usability.
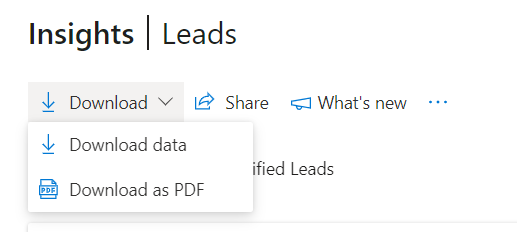
Download
You have an option to download the raw data and download as PDF by clicking on Download option.
Share
You can share the link or screenshot to this page via Email or Teams.
What's new
You can view all the updates related to the page in this section. You can also take a Quick tour and Page guide tour from this panel.
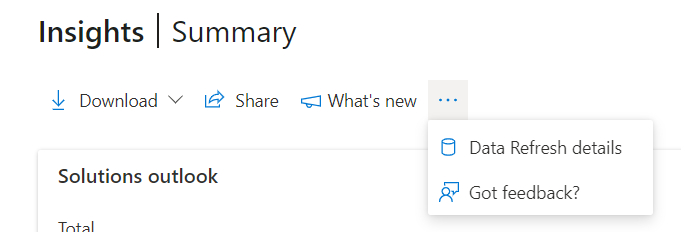
Data refresh details and Feedback
You can view the data refresh details for all the widgets available in the page. You can also share your feedback at page level along with screenshot and other details.
Time range filters
You can find a time range selection at the top-right corner of each page. The output of the overview page graphs can be customized by selecting a time range based on the past 1, 3, 6, or 12 months, or by selecting a custom time range. The default time range selection is three months.
Feedback button
Each widget in the page is incorporated with a feedback button to let you provide instant feedback with screenshots and additional details.
Apply filters
You can select the Filters button to open the panel that lets you filter all the data on page by Customer name, Country/region, Lead type, Offer, and Referral program. Here are the details of these filters.
Customer name: The default is All, but you can limit the data to one or more customers that you select. This is applicable for Marketplace, Qualified and Joint planning leads.
Country/Region: The default is All, but you can limit the data to one or more countries/regions of the customer that you select. This is applicable for Marketplace, Qualified and Joint planning leads.
Referral program: The default is All, but you can limit the data to a specific referral program. This filter is visible only if your organization is registered in the referral program. This is applicable only for Qualified leads.
Lead type: The default is All, but you can choose to limit the data to leads that are either Profile leads or Offer leads. This is applicable only for Marketplace leads.
Offers: The default is All, but you can choose to limit the data to leads generated through one or more offers. This is applicable only for Marketplace leads.
Solution name: The default is All, but you can choose to limit the data to specific solution area. This is applicable only for Joint Planning leads.
The data in all the widgets will reflect the date range and any filters you've selected, except as noted. Some sections also allow you to apply other filters, such as filtering to a specific offer.
Summary
This widget shows the summary of how marketplace, qualified and joint planning leads are performing.
Under Marketplace leads tab, the widget shows the count of page visits, call to action (CTA) button clicks, leads generated, and the total leads won value in USD for the selected period. This widget has pivots on Offer leads and Profile leads.
Select Offer leads to view the summary of leads generated through offers published in marketplace.
Select Profile leads to view the summary of leads generated through business profile published in AppSource.
Under Qualified leads tab, the widget shows the count of leads received, leads accepted, leads marked as Won and the total lead won value in USD for the selected period.
:::Under Joint Planning leads tab, the widget shows the count of leads received as part of joint planning, leads accepted as part of joint planning, leads marked as Won as part of joint planning and the total lead won value in USD for the selected period as part of joint planning.

The percentage change metrics (shown in red or green, with an arrow indicator) indicate the difference between the last full month in the selected date range and the first full month in that range. For example, suppose the current date is June 15, and you've selected the 3M filter to show data for the last three months. In this case, these metrics would show the difference between May (the last full month in the selected time period) and March (the first full month in the selected time period) the date range selected is last 3M, the comparison would be between the data for May and the data for March.
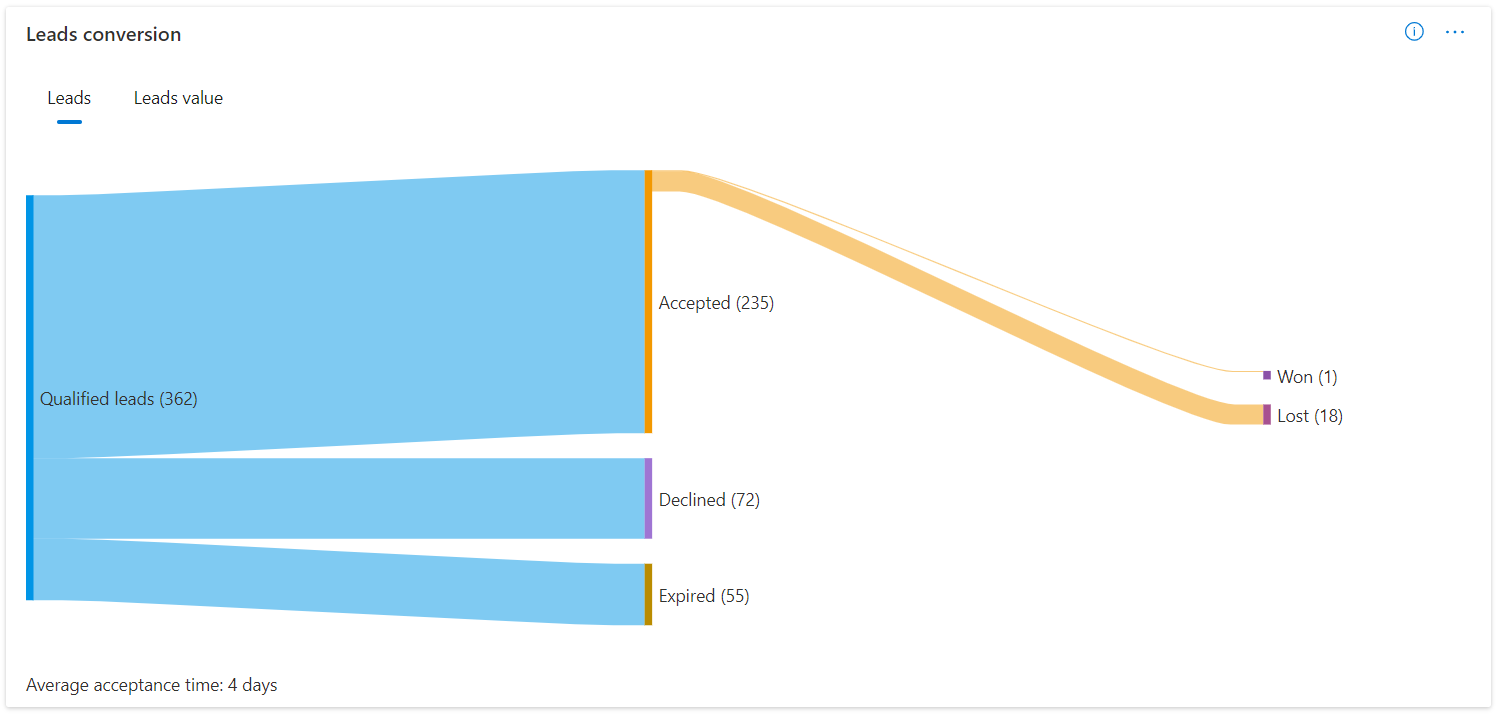
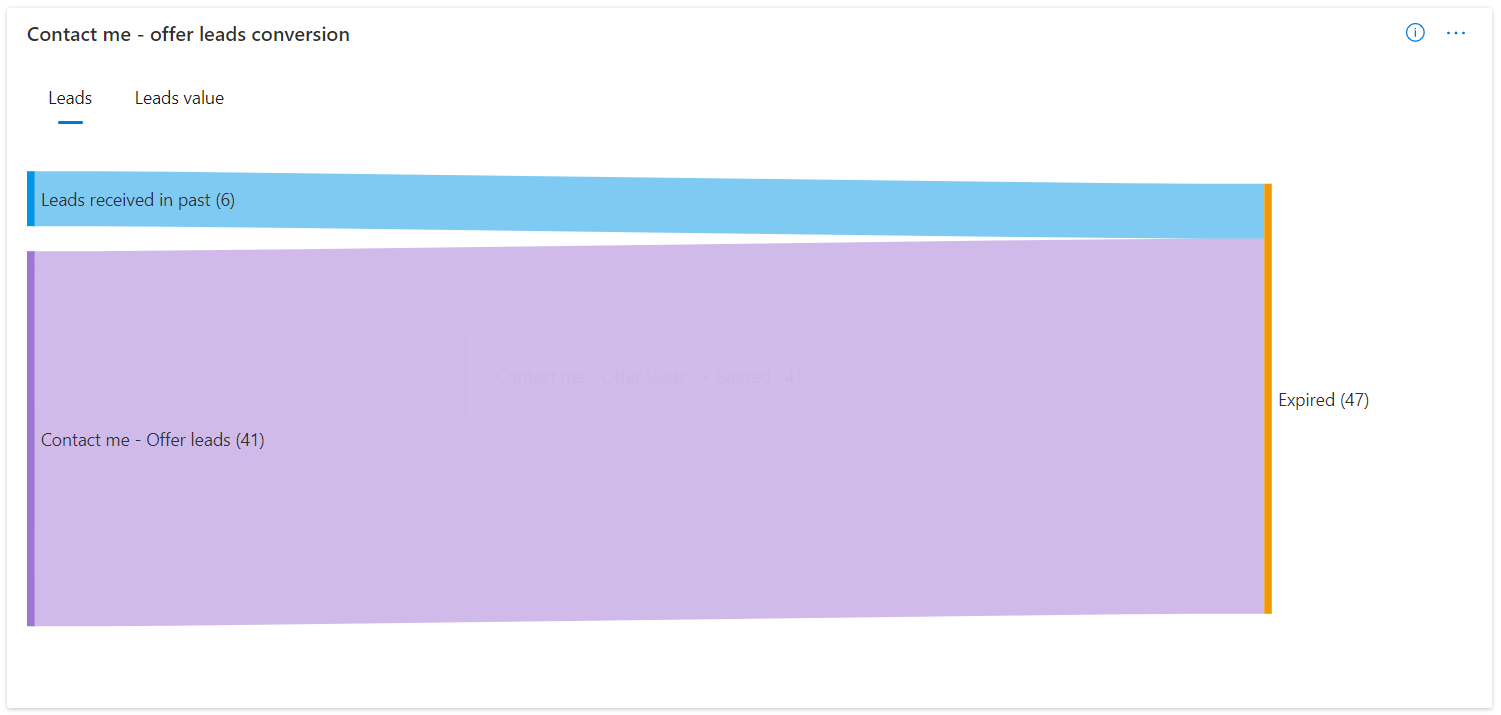
Conversion funnel
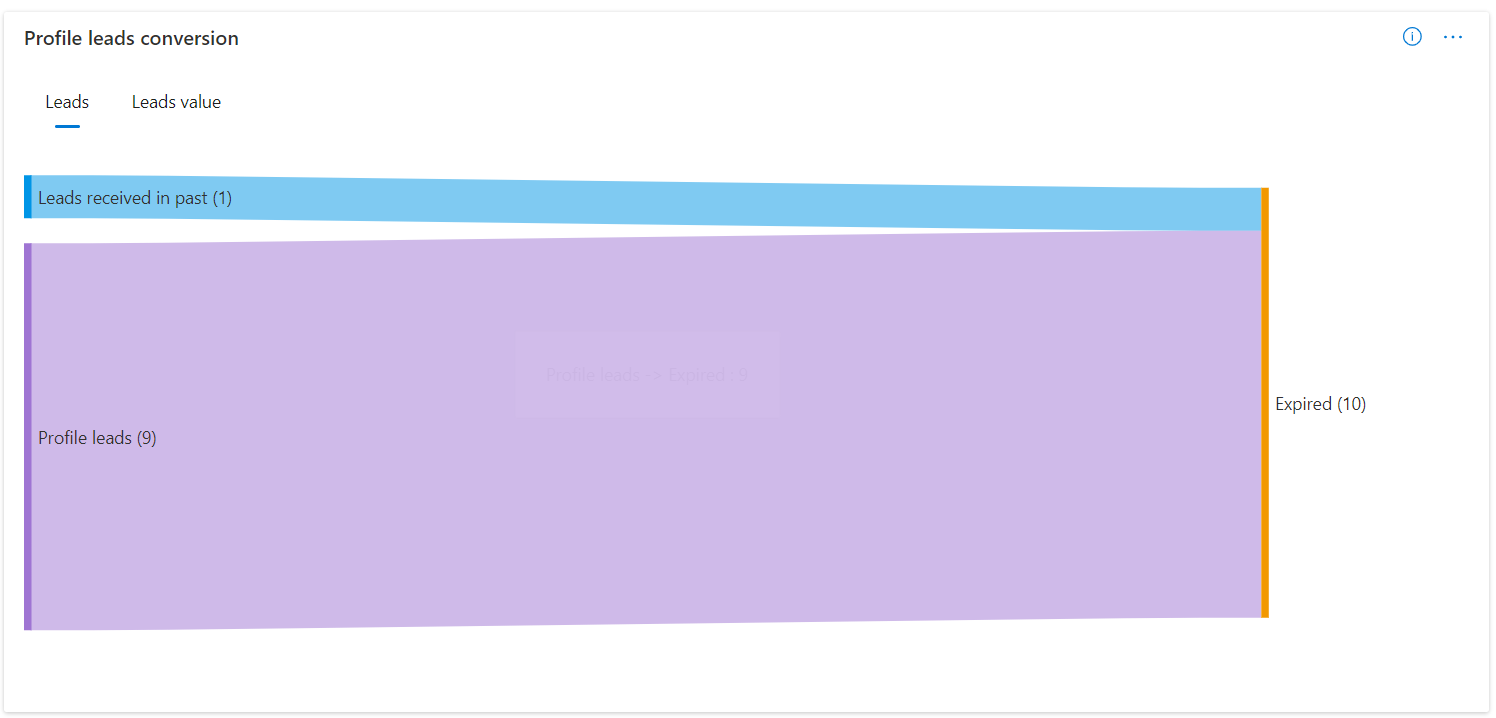
This section shows a visual indicator of how your leads are moving from one state to another through their life cycle. You can view the entire life cycle based on the count of leads and the leads value in USD based on the main pivot for this section. The first section is labeled with the type of the deal to give you a visual indicator of the volume or value by type. There's also a section, Leads from the past, which is used to indicate the leads for which you've taken action of either accepting/declining them or marking them as won/lost in the time period that has been selected for the report. You can apply filters to view the progress of the deals across various stages in their life cycle.
Under Marketplace leads tab, you'll view two separate conversion funnels for Profile leads and Contact me-offer leads.
You can also view the average acceptance time and average time taken from leads received to win in this widget.
Note
Conversion funnel isn't available for leads generated through Get it now offers, as these leads are informational in nature and does not require any action from partners in Partner Center.
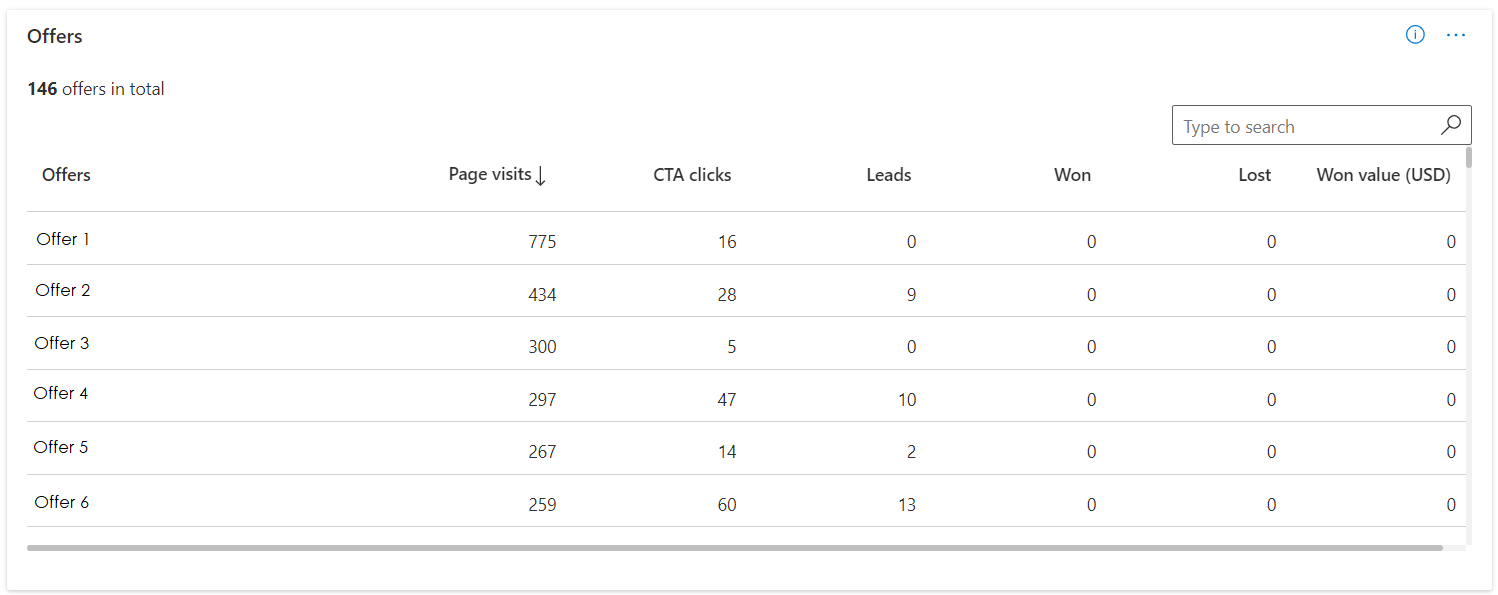
Offers
This widget is available under the Marketplace leads tab. You can view the insights against offers published in marketplace.
Note
Won, lost and won value (USD) isn't available for leads generated through Get it now offers, as these leads are informational in nature and does not require any action from partners in Partner Center.
Geographical spread
This section shows the countries/regions where deals came from, along with details for each country/region. There's a table view of the deal details for each country/region.
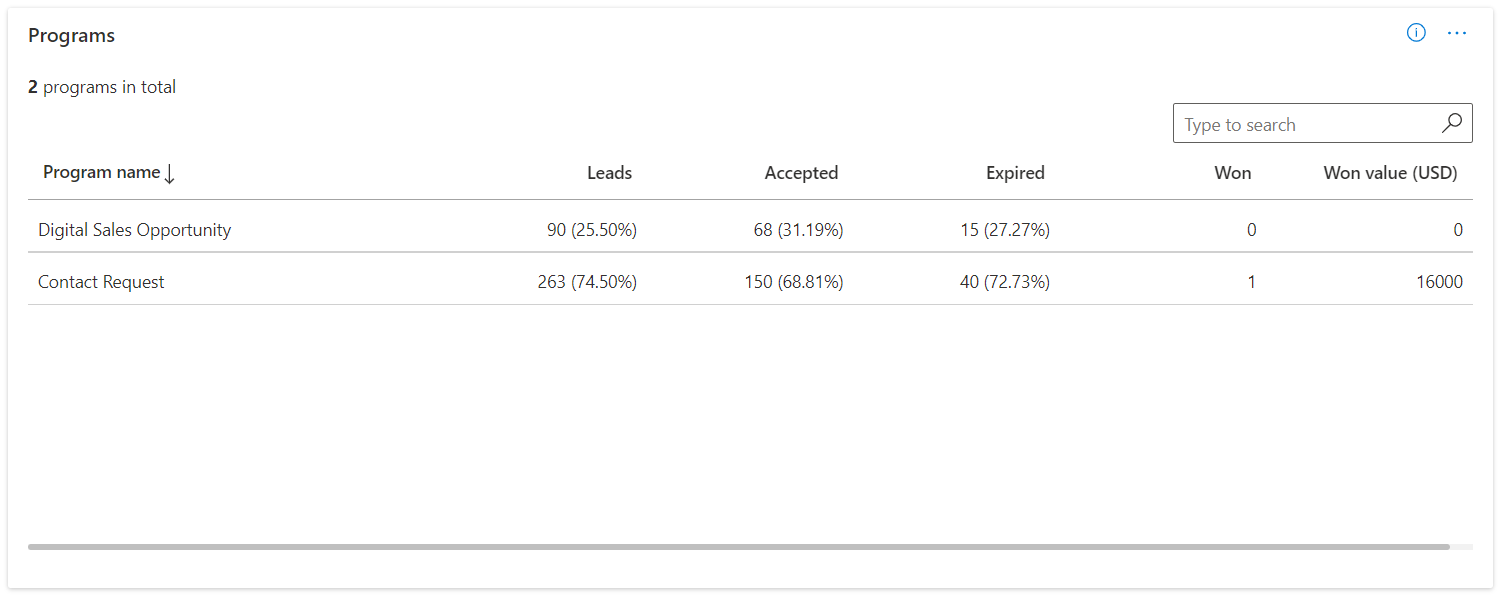
Programs
This table lets you see which of your referral program leads are driving the most referrals and the highest deal value. The table has total leads, accepted leads, the leads that expired in both percentage and absolute terms, and the leads that went in to won state along with the total leads value won in USD currency.
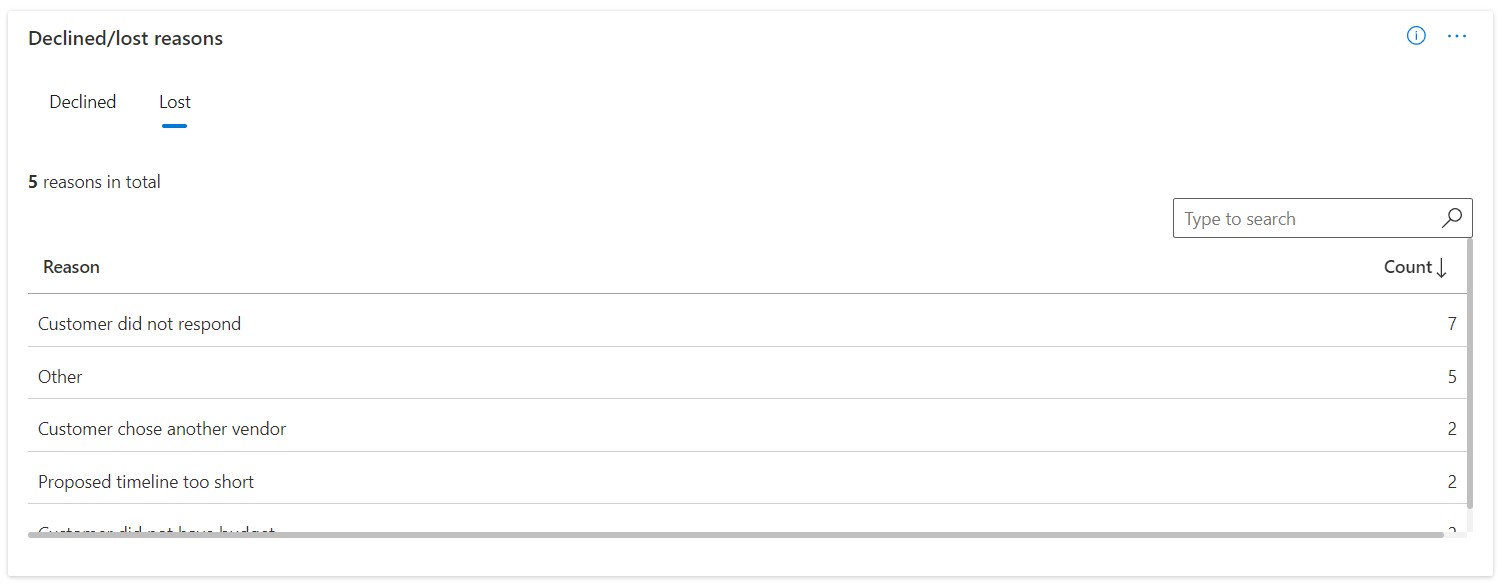
Declined and lost reasons
This section will help you to analyze the reasons why the leads are getting marked as Declined or Lost by your company. The options in these representations are the same reasons that your sellers have chosen while closing the lead as declined or lost.
Comparison charts
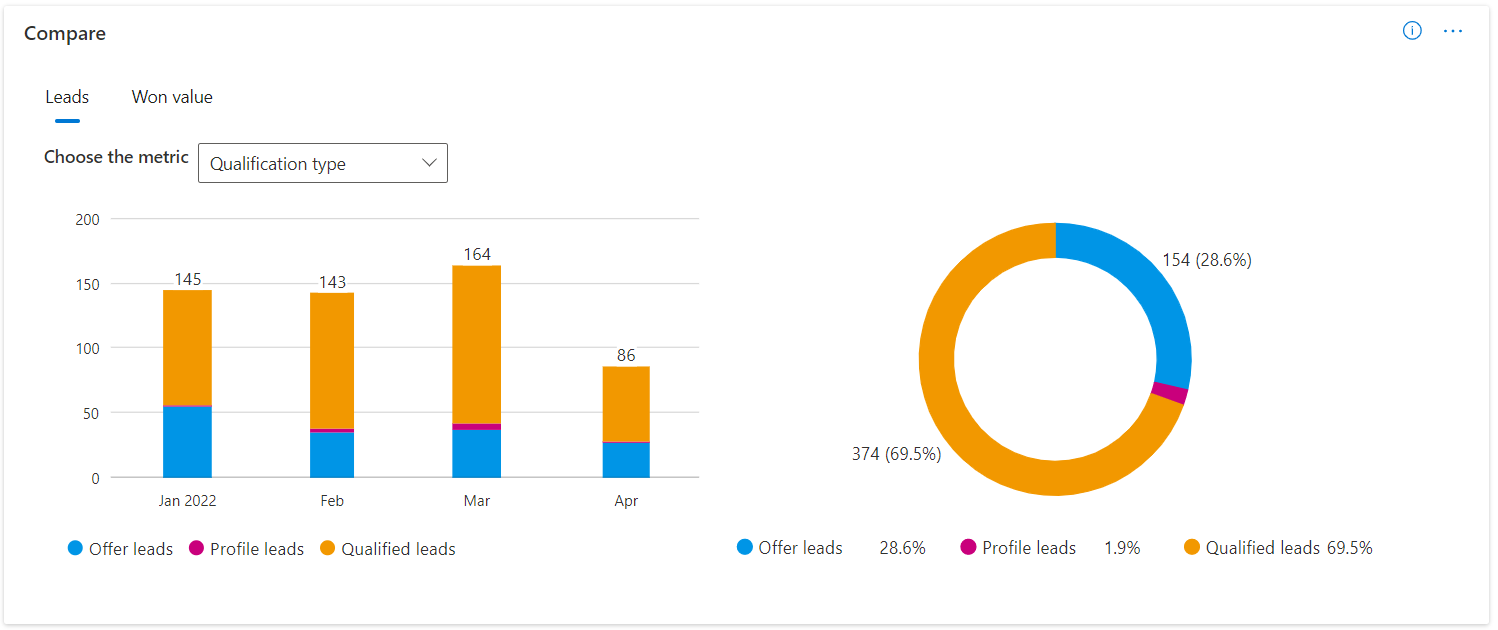
The comparison section helps you compare the data related to leads based on multiple dimensions, both on the volume and the leads won value in USD pivot.
Under Marketplace leads tab, you can choose to compare data on:
- Leads source: Applicable values are Microsoft Marketplace and Azure portal
- Country/region: You can select up to 3 countries/regions
- Offers: You can select up to three offers
- Offer listing: Applicable values are Get it now and Contact me
Under Qualified leads tab, you can choose to compare data on:
- Qualification type: Applicable values are Qualified leads, Offer leads, and Profile leads
- Country/region: You can select up to 3 countries/regions
- Referral program: You can select up to three referral programs
The first graph, which is a bar chart will have data presented with a month-on-month trend based on the main pivot, which is volume or the deals value won. There's also a pie chart to the right of the bar chart, which shows the distribution by percentage for the same data.
Note
Referrals that are closed as error, won't be considered in the insights widgets and data download.
Joint Planning Leads details
This table lets you see the Joint Planning leads created, their status, solution area, Contract value and Estimated closed date.

Download the analytics
You can download the analytics data for marketplace, qualified and joint planning leads. The following information describes the download functionality.
You can download a maximum of 5,000 records by selecting the Download data button. Records will be sorted in descending order based on referral creation date.
The download function considers the timeline and the filters that have been applied.
Partner can choose to download the report in either CSV (comma-separated value) or TSV (tab-separated value) format.
It can take a few minutes to download the records.
Wait for the download to complete. Navigating away will cancel the download.
If you have more than 5,000 records go to Downloads Hub and download your reports.
Note
This will download analytics data for the selected period. Go to the Leads page in the Referral workspace for exporting transactional data.
No data
There can be multiple reasons why you're getting a blank chart like shown in the diagram when accessing the leads analytics as described.
- There's no data for this account. Try creating deals to get this report populated.
- There's some network connectivity issue. Check your internet connection and try again.
- There are no records matching the filters that you applied. Try resetting the filters.
- There's a delay between the lead state change and for the same to be updated in the analytics report. Check the report after 24 hours.

Tip
To see how your co-sell opportunities are performing, review the Co-sell opportunities insights page.

