Note
Access to this page requires authorization. You can try signing in or changing directories.
Access to this page requires authorization. You can try changing directories.
Monitor can help you debug and diagnose problems, which help you build faster, more reliable model-driven apps. Monitor provides a deep view into how an app runs by providing a log of all activities in your app as it runs.
Important
Monitor must be run on the model-driven app and not directly on a custom page.
Start a Monitor session
There are two ways to open a Monitor session.
From Power Apps
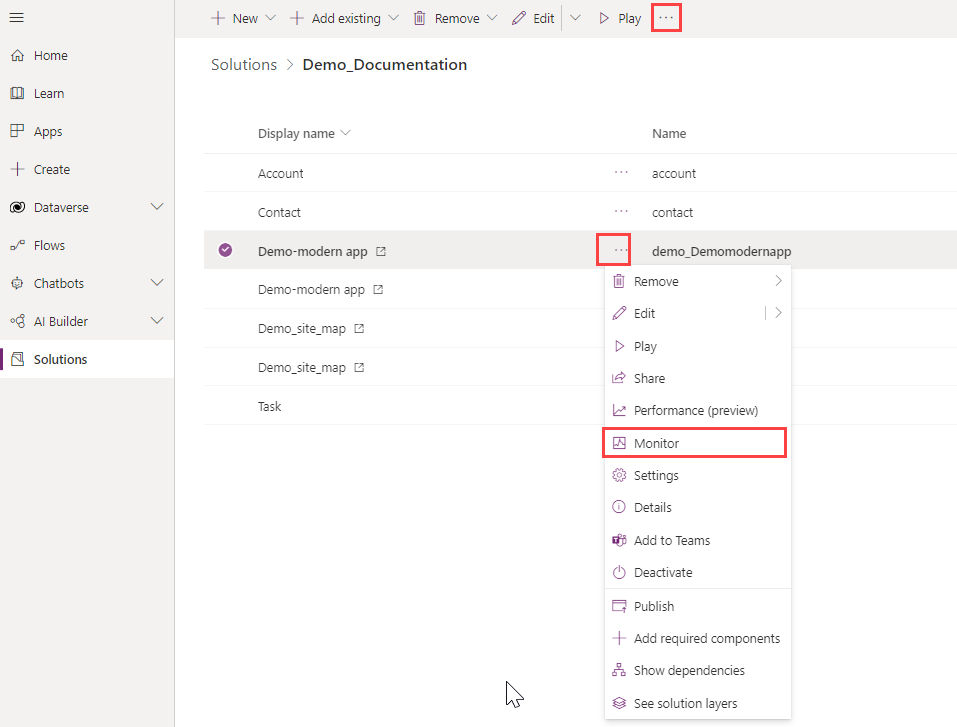
Sign in to Power Apps, select Apps.
Select ... next to the model-driven app or on the global command bar, and then select Monitor.
On the Monitor page, select Play model-driven app on the command bar.
When prompted, select Join.
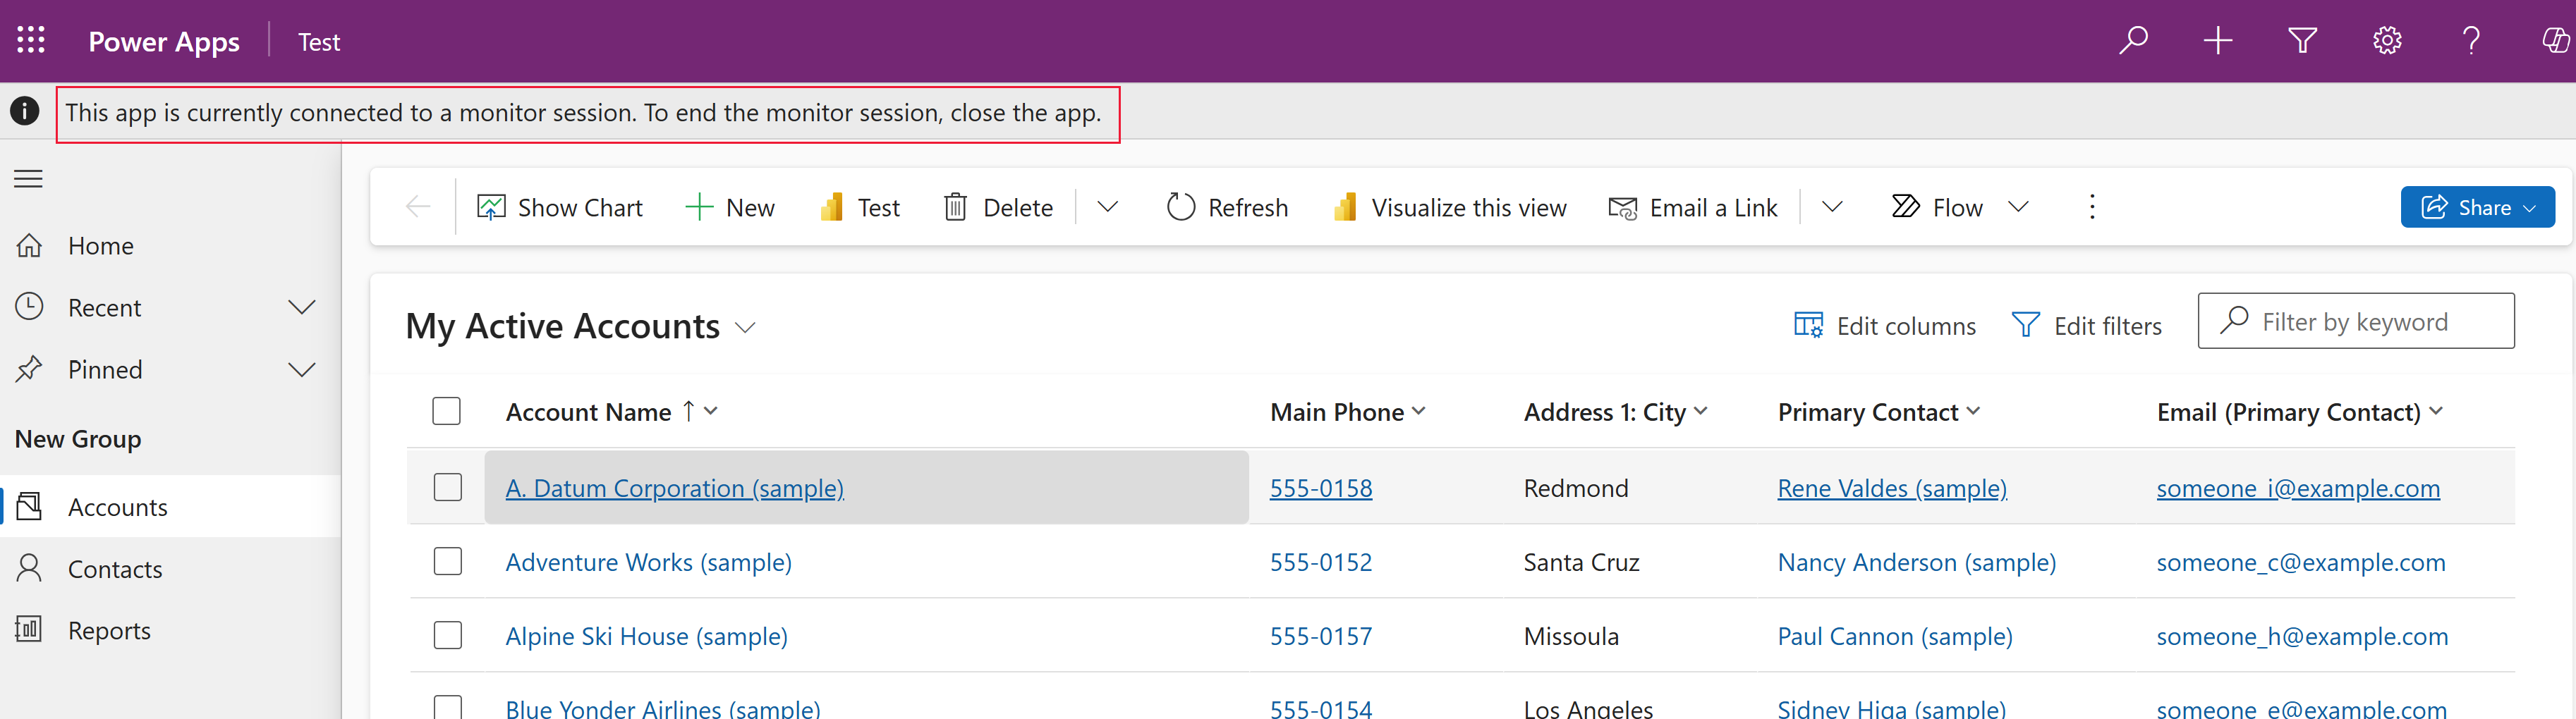
The app loads in a new browser tab with a message indicating the monitoring session. Switch back to the Monitor tab to view activity.

From a model-driven app
Play your model-driven app.
Add
&monitor=trueto the end of the URL in your web browser, and then refresh the page.Select Monitor on the command bar.

Filter monitored activity
When you filter on a model-driven app custom page-related events in Monitor, you can get information about related tables, tables, controls, and components, such as on a custom page, in Monitor as your app runs.

For example, to filter on the custom page that uses the Gallery1 control, select the Control column header > Filter by, enter Gallery1, and then select Apply.
For more information about model-driven app monitoring, go to Debug a model-driven app with Monitor
Close a Monitor session
To close the monitoring session, close the browser tab where the monitored model-driven app is playing.