Note
Access to this page requires authorization. You can try signing in or changing directories.
Access to this page requires authorization. You can try changing directories.
Note
This article is a high-level overview of the navigation experience for business users. For creation tasks, see Tutorial: Get started creating in the Power BI service. For details about interactions like filtering, focus mode, exporting, Q&A, alerts, and subscriptions, see Interact with reports and dashboards.
You know the basics of the Power BI service. Here's how to get around the Power BI service. Some teammates work in Power BI Desktop to combine data and build reports, dashboards, and apps for others. They're designers and creators. You work in the Power BI service to view and interact with content they publish. You're a business user, and this overview is for business users.
Prerequisites
Not signed up for Power BI? Sign up for a free trial before you begin.
Review Basics of the Power BI service.
To view Power BI content (reports, dashboards, apps) created by designers, you need either:
A Power BI Pro or Premium Per User (PPU) license
A Power BI Premium subscription in your organization, with the content shared from a Premium capacity Learn about licenses and subscriptions
For this overview, you don't need either condition. Microsoft provides sample content directly in the Power BI service. Use the samples to learn your way around the service.
Navigation pane at a glance
| Nav item | Purpose | Typical actions | Details and learn more |
|---|---|---|---|
| Home | Personalized landing (recent, favorites, recommended). | Open recent/favorites, launch apps, global search. | Central starting point showing activity, favorites, recommendations, and quick links. Learn more about Home. |
| Browse | List-based access to recent, favorites, shared. | Sort, filter, open items. | Consolidated lists let you scan and open commonly accessed content without navigating workspaces. |
| OneLake | Discover semantic models and other reusable data artifacts. Formerly called Data hub. | Find data, view metadata, request access. | Enterprise discovery surface for governed data you can build reports on; improves reuse and reduces duplication. Learn more about OneLake. |
| OneLake catalog | Fabric-wide discoverability & governance view for data items. | Search/filter, request access, reuse data. | Broader governed asset catalog (beyond Power BI) for cross-___domain analytics. Learn more about the OneLake catalog. |
| Create | Start new content (report, semantic model, quick create, upload). | Quick create, import files, start metric set. | Launch point for building; options vary by license, role, and enabled Fabric features. |
| Apps | Access packaged collections (reports/dashboards). | Open or install apps, switch views. | Curated bundles deployed to groups for consistent consumption. Learn more about Apps in Power BI. |
| Workspaces | Team/content containers (dashboards, reports, semantic models, dataflows). | Navigate content, manage access (if permitted). | Collaborative areas before packaging as apps; role-based access. Learn more about Workspaces. |
| Metrics | Track organizational goals / metric sets. | View, update status, drill into metrics. | Scorecards aggregate KPIs for progress visibility; may require specific permissions. Learn more about Metrics |
| Copilot | AI assistance (tenant-controlled availability). | Summarize, ask questions, generate insights. | Natural language help for understanding, describing, or exploring data; availability depends on admin settings. Learn more about Copilot |
| Learn | Tutorials, samples, videos, training links. | Open sample reports, launch learning modules. | Built‑in training hub to accelerate onboarding and self‑service skills. |
| Monitor* | Operational views (refresh, performance, capacity) – role-based. | Inspect refreshes, performance (eligible roles). | Administrative/advanced visibility into system health and workload performance. |
| Real-Time* | Real-time items (event streams, KQL DB) – Fabric feature dependent. | Explore/create real-time artifacts. | Entry point for streaming and low-latency analytical scenarios when Fabric real-time features are enabled. Learn more about Real-Time Intelligence. |
| Deployment pipelines* | Lifecycle promotion (dev/test/prod). | Compare, deploy stages. | Visualize and promote content between stages for controlled release management. |
| Workloads* | Capacity workload settings (admin). | Adjust workload configuration. | Admin surface to tune capacity resource allocation across feature workloads. |
*Conditional: Appears only with specific roles, licenses, or Fabric features enabled.
Open the Power BI service
Open the Power BI service (app.powerbi.com) and sign in if you're prompted.
Open a Power BI sample. In the navigation pane, select the Learn icon
 . In the Learning center, scroll to Sample reports. Select the right arrow until you reach Sales and Marketing Sample, then select it.
Select My workspace. The Power BI service installs the sample there—your private sandbox for learning and experimenting. Only you can see it. Review the sample details.
The sample includes one report, one dashboard, and one semantic model. Most content for business users doesn't provide direct access to semantic models, but these samples are for all users and include them.
Open a dashboard and a report
A dashboard is a single page that shows key visuals from one or more reports.
Open the Sales and marketing sample dashboard.
Note
If the dashboard doesn't appear right away, the sample file might be large. Try again in a few minutes.
The dashboard opens in the Power BI service. Dashboards differentiate the Power BI service from Power BI Desktop. Learn about dashboards.
The top menu bar shows dashboard actions. Select More options (...) to see the full list.
The visuals on the dashboard are arranged as tiles. Hover over a tile and select More options (...) to see its interaction options.
Select a dashboard tile to open its source report. The report opens to the page that contains the tile's visual. In this example, selecting the treemap tile opens the YTD Category report page.
A report has one or more pages. Each page tells a story with visualizations, text, shapes, and images.
Reports have several sections. The left side shows the list of report pages. Across the top is the menu bar with report actions. Available options depend on the roles and permissions the report designer assigns to you. The right side has the Filters pane. The center canvas contains the report. Like the dashboard, you can take actions on the entire report, an individual visual, or a single page.
Learn more about Power BI reports.
Use the navigation pane
The navigation pane becomes more useful as colleagues share content with you. This article focuses on the Power BI service for a business user whose colleagues share many reports, dashboards, and apps.
Home
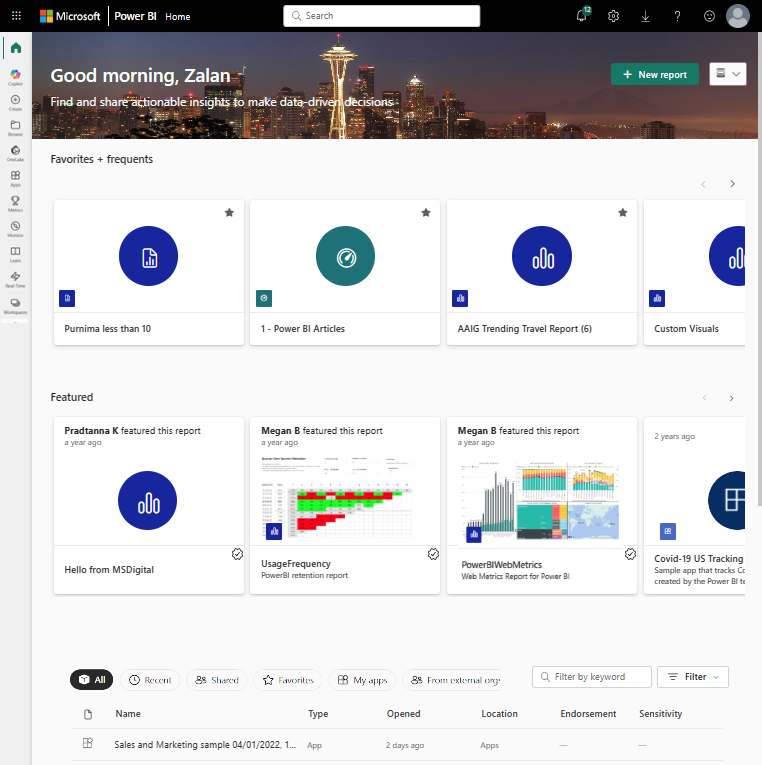
The top icon in the navigation pane is your Power BI Home. It's the default landing page when you sign in to the Power BI service. Home brings together search, sorting tools, the navigation pane, and a canvas with cards you select to open content. At first, you might not see many cards. The number grows as colleagues share content.
Power BI Home is the landing page for business users. It surfaces the content you can access and offers multiple ways to open it quickly.
Key elements:
- Layouts: Simplified (default) and Expanded (switch via the View menu). Your choice persists.
- Sections: Favorites + frequents, Featured, and a tabbed list area.
- Tabs (availability depends on your activity and tenant): All, Recent, Shared, Favorites, My apps, From external orgs (preview), plus recommended items surfaced automatically.
- Optional getting started resources for new users; can be hidden.
- Left navigation pane mirrors major entry points: Browse (lists Recent, Favorites, Shared with me), Data hub, Apps, Learn, Workspaces, plus Home itself.
- Workspaces: My workspace (personal), plus any shared workspaces you are granted access to; each lists dashboards, reports, semantic models, dataflows, and other artifacts.
- Global search (top bar) finds content by name, owner, or keyword across items you can access.
- Featured content can be promoted by authorized workspace roles (Administrator, Member, Contributor) if tenant settings allow.
- External tenant (B2B) semantic models may appear under From external orgs when enabled.
Use Home to:
- Open recently used items
- Jump to favorites
- Discover recommended or shared content
- Launch apps
- Pivot to the Data hub or Workspaces for broader exploration
Home supports two layouts:
- Simplified (default): High-value cards (Recommended, Recent, Favorites) with tabs for quick switching.
- Expanded: Adds richer list detail and emphasizes workspaces. Switch the layout from the Home View menu. Your choice persists.
Search, sort, and filter
- Use the global search box (top bar) or local list search boxes to match on title, type, or owner.
- Sort by selecting column headers (where enabled). Select again to toggle ascending or descending.
- Apply Filters (list toolbar) to narrow by type (dashboard, report, app) or owner when lists grow large.
Learn more about Global search.
Find the owner
See who owns a dashboard, report, app, or semantic model. With the item open, select the title menu to show the owner contact. The contact might be an individual or a group.
Clean up the sample
- In My workspace, select More options (...) > Delete for the sample report, dashboard, and semantic model.