Note
Access to this page requires authorization. You can try signing in or changing directories.
Access to this page requires authorization. You can try changing directories.
You can create variables for your Power BI Desktop reports. Variables provide a way for you to visualize and quantify key values and then interact with those values in your reports. To adjust the value of a variable, you can use a slicer.
In Power BI Desktop, you use a parameter to store a variable. This article shows you how to create a parameter and how to create a measure by using a formula that includes the parameter. The article then shows you how to create a visual that changes as you use a slicer to adjust the parameter value.
Create a parameter
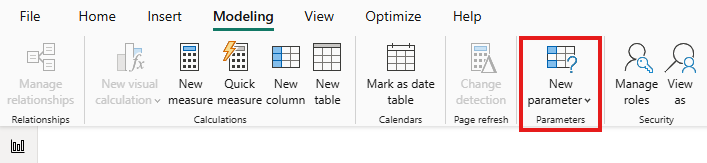
To create a parameter in Power BI Desktop, go to the Modeling tab, and then select New parameter.
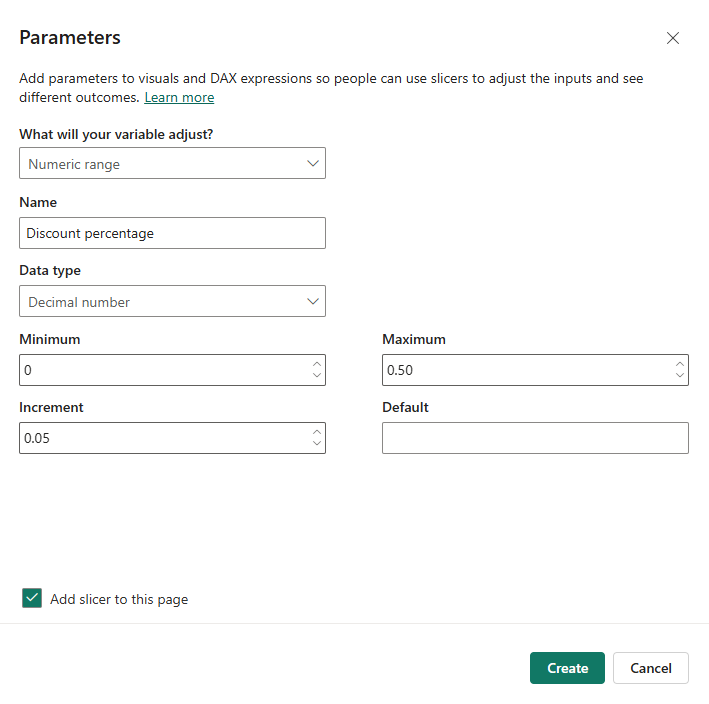
Select Fields or Numeric range. The examples in this article use Numeric range as the type of parameter. Similar procedures apply to using Fields as the type.
In the Parameters dialog, take the following actions:
- For Name, enter Discount percentage.
- For Data type, select Decimal number.
- For Minimum, enter 0.
- For Maximum, enter 0.50, which represents 50%.
- For Increment, enter 0.05, which represents 5%. The increment determines how much the parameter adjusts when you interact with it in a report.
Note
For decimal numbers, precede the value with a zero, as in 0.50, not .50. Otherwise, Power BI can't validate the value, and the Create button isn't available.
If you want Power BI to create a slicer for your parameter, select Add slicer to this page. After you select Create, a slicer is added to the current report page.
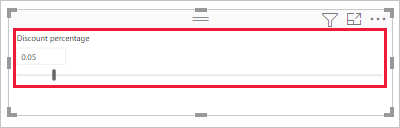

When you create a parameter, a measure is also automatically created. You can use the measure to visualize the current value of the parameter.

After you create a parameter, both the parameter and the measure become part of your model. They're available throughout the report, so you can use them on other report pages. Because they're part of the model, you can delete the slicer from the report page. If you want the slicer back, go to the Fields list. Select the parameter, drag it onto the canvas, and then change the visual to a slicer.
Use a numeric range parameter
This next example shows you how to use a parameter to interact with your data. In this example, you put the parameter from the previous section to use. Specifically, you create a new measure by using a formula that includes the parameter. Then you adjust the value of that measure by using a slicer.
The new measure represents the total sales amount. Its value is calculated by applying the discount rate stored in your Discount percentage parameter.
In Power BI, you can create complex and interesting measures that consumers of your reports can use to visualize the variable of your parameter. For example, you can create a report that sales people can use to observe the following data:
- Their compensation if they meet certain sales goals or percentages
- The effect of discounts on sales
To create the measure, go to the Modeling tab, and then select New measure.
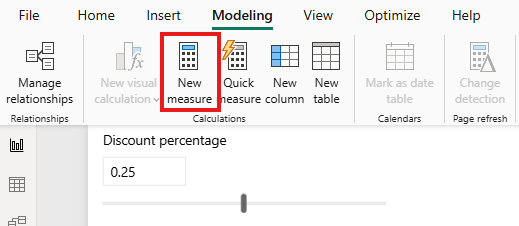
In the formula bar, enter the following formula:
Sales after Discount = SUM(Sales[SalesAmount]) - (SUM(Sales[SalesAmount]) * 'Discount percentage' [Discount percentage Value])This formula creates a measure named Sales after Discount.
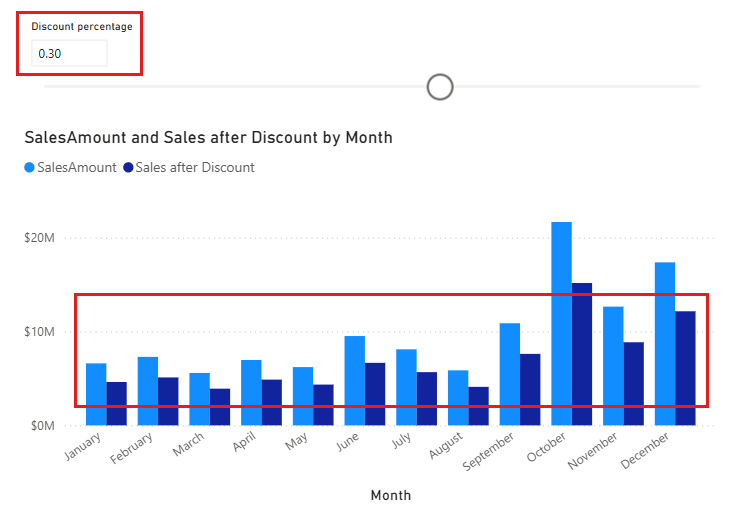
Create a column visual with OrderDate on the x-axis. For the values, use SalesAmount and the new measure, Sales after Discount.
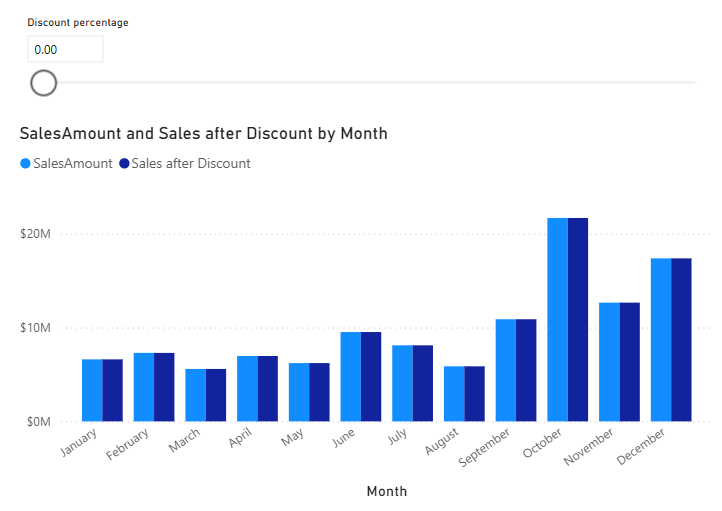
Move the slider for the Discount percentage parameter. The Sales after Discount column reflects the discounted sales amount.


You can use this process to create parameters for any data you want to work with. Parameters are useful in all sorts of situations. Parameters provide a way for report consumers to interact with scenarios that you create in your reports.
Considerations and limitations
When you work with parameters, keep in mind the following considerations and limitations:
- Parameters can have at most 1,000 unique values. If a parameter has more than 1,000 unique values, the parameter values get evenly sampled.
- Parameters are designed for measures within visuals. If you use a parameter in a dimension calculation, the parameter value might be calculated incorrectly.