Note
Access to this page requires authorization. You can try signing in or changing directories.
Access to this page requires authorization. You can try changing directories.
As a Microsoft Power Platform admin, you need visibility into how your organization uses Power Apps and Power Automate. Insights into your adoption help you govern and secure the platform, identify patterns, and enable you to nurture your makers to accelerate adoption.
Out of the box, the admin analytics that are part of the Power Platform admin center provide you with environment-level analytics based on your usage for the past 28 days. As your adoption grows, you might need customized dashboards that show more insights and allow you to apply richer filters to your data over a longer period.
The Power BI dashboard of the Center of Excellence (CoE) Starter Kit provides a holistic view with visualizations and insights into resources in your tenant: environments, apps, Power Automate flows, connectors, connection references, makers, and audit logs. Telemetry from the audit log is stored from the moment you set up the CoE Starter Kit, so you can look back and identify trends over time for longer than 28 days.
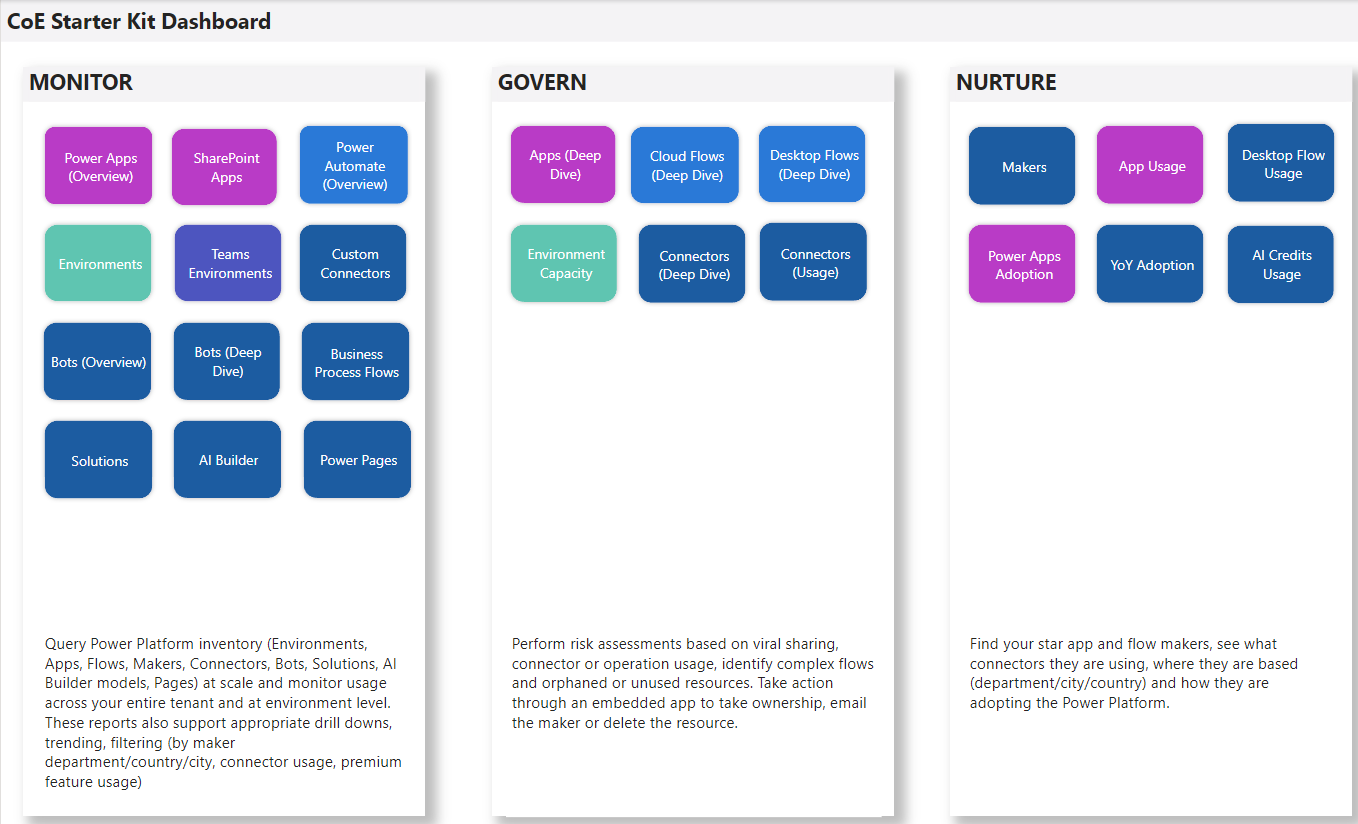
The dashboard provides analytics and data for the following areas:
- Monitor: Oversight of tenant resources
- Govern: Drive actions through insights
- Nurture: Learn about your community
To use the dashboard, start by installing the core components of the CoE Starter Kit and configure the Power BI dashboard by following the dashboard setup instructions.
Note
Screenshots are taken from a sample of the report published as an app. If you work in Power BI Desktop or have published the report to a workspace, your navigation and view will be different.
The first page of the dashboard provides an overview of all areas and their purpose, in addition to buttons to use to navigate to different sections and pages.