Business performance planning dimensions
Dimensions are descriptors that define your fact data. A dimension consists of columns that are referred to as attributes of the dimension. You can use these columns to create hierarchical structures in your analysis. For example, a dimension might include columns for the date, the month, and the year. Then, users can analyze data by drilling down from the year to the month to the date. Common dimensions are people, product, place, and time.
Two types of dimensions in planning are:
- Linked – Dimensions that are connected to Dataverse tables.
- Standard – Nondynamic dimensions that you can update manually by adding new rows or by uploading new data from Excel.
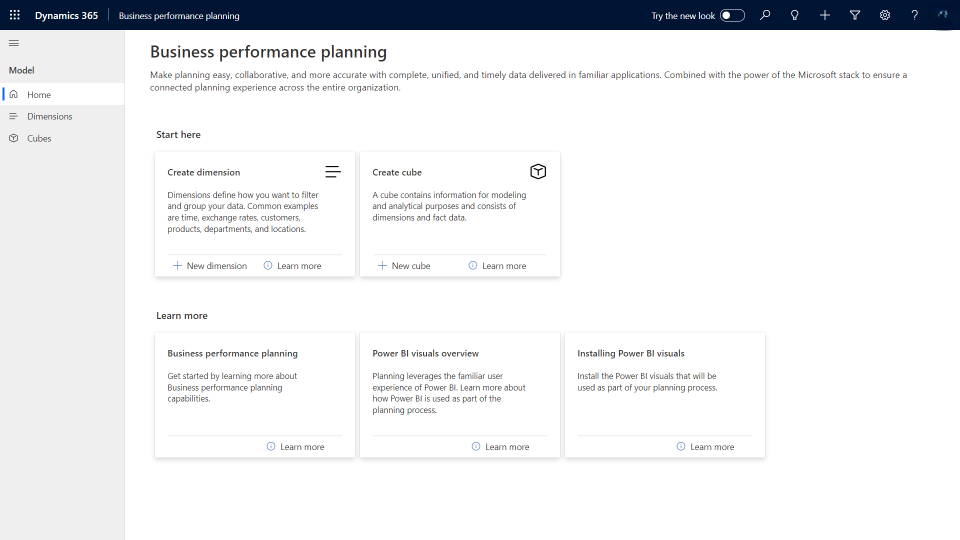
Create dimensions in Business performance planning
In Business performance planning, you can create dimensions in three ways:
- From the current environment (linked dimensions)
- From Excel
- Manually
Create a dimension from the current environment
You can create a new dimension in Business performance planning from an existing Dataverse table. This type of dimension is referred to as a linked dimension.
To create a linked dimension, follow these steps.
Go to Create dimension.
In the Dimension field, enter a name for the dimension. This name can contain spaces and special characters.
In the Table field, enter a name for the table that's created in Dataverse. This table name shows in Power BI when you work with visuals.
Select to add columns from the current environment. (The current environment is the Microsoft Power Platform environment where you deployed Business performance planning.) The Linked table list becomes available.
Note
The list shows native Dataverse tables and available virtual entity tables. For more information, see Enable Microsoft Dataverse virtual entities.
Select columns from the Dataverse table to include in the dimension. To select a column, select the circle that appears to the left of the column name when you hover your mouse cursor over it.
The selected columns appear in Power BI, and you can use them to sort and filter data in the planning visuals. The system automatically removes some columns. For example, you select the Account table for the dimension. That table includes multiple columns that you might want to filter or sort data on. However, it also includes columns that might not be as useful for your analysis of the data, such as Created by and Modified by. Therefore, the system automatically removes these columns.
Important
The dimension that you create must have a primary key to ensure that unique records exist in the dimension table. The Business performance planning app automatically selects the primary column from the source table. The column that the program uses as the primary column shows at the top of the page in the Select columns step of the wizard.
In the Adjust columns step of the wizard, you can update the column name for each column that you selected to include in the dimension. For example, you select to include the Address 1: City column from the entity, but you only want the name to appear as City.
After you finish entering the information, you can create the dimension.
Create a dimension from Excel
You can create a new dimension in Business performance planning from a Microsoft Excel file.
Go to Create dimension.
In the Dimension field, enter a name for the dimension. This name can contain spaces and special characters.
In the Table field, enter a name for the table that's created in Dataverse. This table name shows in Power BI when you work with visuals.
Select to add columns from Excel. The Upload an Excel file option becomes available. If your workbook has multiple tabs, select the tab to use when you create the dimension.
Select the columns from the Excel file to include in the dimension. To select a column, select the circle that appears to the left of the column name when you hover your mouse cursor over it.
Important
The dimension that you create must have a primary key to ensure that unique records exist in the dimension table. Therefore, select the column that ensures unique records. The column that the program uses as the primary column shows at the top of the page in the Select columns step of the wizard.
In the Adjust columns step of the wizard, you can update the column name for each column that you selected to include in the dimension. For example, you select to include the Address 1: City column from the Excel workbook, but you only want the name to appear as City.
After you finish entering the information, you can create the dimension.
Create a dimension manually
You can manually create a new dimension in Business performance planning.
Go to Create dimension.
In the Dimension field, enter a name for the dimension. This name can contain spaces and special characters.
In the Table field, enter a name for the table that's created in Dataverse. This table name shows in Power BI when you work with visuals.
Enter the name of each column that you want to include in the dimension. Use commas to separate the column names.
For this procedure, you skip the Select columns step of the wizard because the system automatically includes the columns that you specify when creating the dimension.
Important
The dimension that you create must have a primary key to ensure that unique records exist in the dimension table. The Business performance planning app automatically creates a Name column for manually created dimensions and uses that column as the primary column. The column that the program uses as the primary column shows at the top of the page in the Select columns step of the wizard.
For this procedure, you skip the Adjust columns step of the wizard because the system uses the display name of each column when you create the dimension in the General section.

After you finish entering the information, you can create the dimension.
Use dataflows to populate dimensions
Use dataflows if your dimension data is a combination of multiple sources or if you must have some level of transformation done to get data into the proper structure for planning.
We recommend that you use dataflows to load production data because it better supports typical production volume and complexity. Dataflows also provide a transformation experience, detailed status results when loading data, and the option to schedule refreshes of the data.
Dataflows are self-service, cloud-based data preparation technology. Dataflows help customers ingest, transform, and load data into Microsoft Dataverse environments, Power BI workspaces, or your organization's Microsoft Azure Data Lake Storage account. You can create Dataflows by using Power Query, a unified data connectivity and preparation experience that’s already featured in many Microsoft products, including Excel and Power BI. You can trigger Dataflows to run on demand or automatically on a schedule, and the system always keeps data up to date. For more information, see What are dataflows?.
Dataflows can populate dimensions and cubes in planning. When you're linking a dataflow to the dimension or cube, when you update the data source of the dataflow, the system updates planning based on the refresh frequency that you define in the dataflow.
For more information, see Load data into Business performance planning using dataflows.