Use Copilot in Power BI to prepare and model data
Power BI semantic models are the foundation for all reports and incorrectly designed semantic models might result in limited or inaccurate reports. Copilot in Power BI helps increase productivity and bridge skill gaps by assisting with data preparation, model configuration, and DAX calculations. This unit explores ways to use Copilot in Power BI Desktop to develop a semantic model.
Note
See Enable Copilot in Power BI for more information about how to use Copilot in your organization.
Prepare data in Power Query
Clean, consistent data is the foundation for accurate reporting and analysis. Copilot can help automate repetitive tasks such as resolving inconsistencies, setting data types, and applying naming conventions. Use Power Query Editor to profile, clean, and transform your data.
- Profile: Assess column quality, distribution, and profile.
- Clean: Address missing values, correct out-of-range or inconsistent entries, and remove duplicates.
- Transform: Rename columns, set correct data types, and reshape tables as needed.
This process also helps prepare your data for use with AI, which is covered later in this module.
Configure a semantic model
Relationships allow you to filter and summarize data in report visuals later in the development process. You can use the autodetect relationships feature to get you started, then use Copilot to summarize the initial semantic model to determine if any other relationships are needed.
In the following image, there's a single fact table connected by relationships to dimension tables. Power BI reports work best when using a star or snowflake schema for the semantic model.
Copilot can summarize your semantic model and provide a high-level overview of the structure and key elements. This summary can help you understand important objects or missing relationships, for example.

Query with DAX
There are four views in Power BI Desktop: Report, Table, Model, and DAX Query. In the DAX Query view, you can select Copilot in the ribbon and use natural language to describe what you want.
Consider the following prompt total sales for all salespeople individually for all items in the accessories category entered into the Copilot feature of DAX Query view.
This prompt is intending to calculate each individual salesperson's total sales for the accessories category. At AdventureWorks, there are multiple categories with multiple products within. Accessories have low sales, and the business requirement is to understand better who is selling more accessories, in case they can share valuable information.
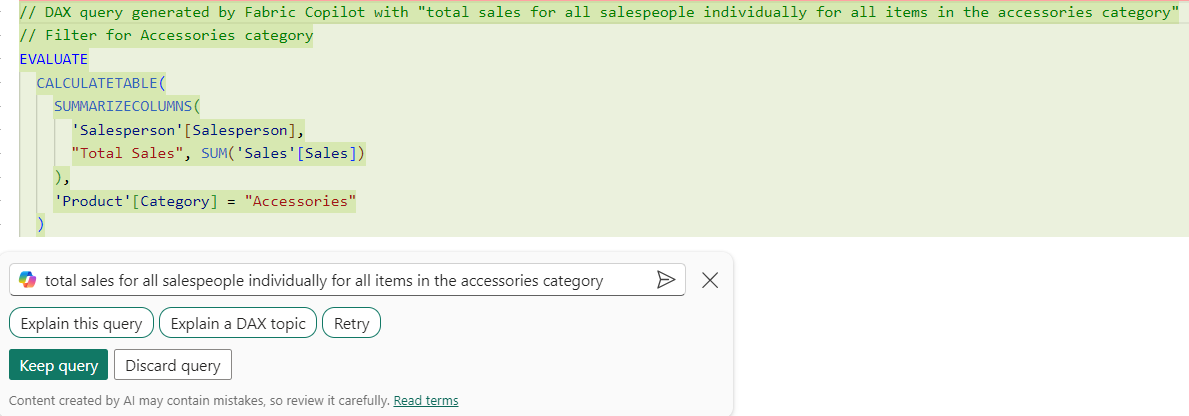
// DAX query generated by Fabric Copilot with "total sales for all salespeople individually for all items in the accessories category"
// Total sales for each salesperson for items in the accessories category
EVALUATE
  SUMMARIZECOLUMNS(
    'Salesperson'[Salesperson],
    FILTER('Product', 'Product'[Category] == "Accessories"),
    "Total Sales", [Total Sales]
  )
The following table shows sample results of the Copilot-generated DAX query.
| Salesperson | Total Sales |
|---|---|
| Stephen Jiang | 8374.76 |
| Michael Blythe | 38682.84 |
| Linda Mitchell | 66916.05 |
Create measures from DAX queries
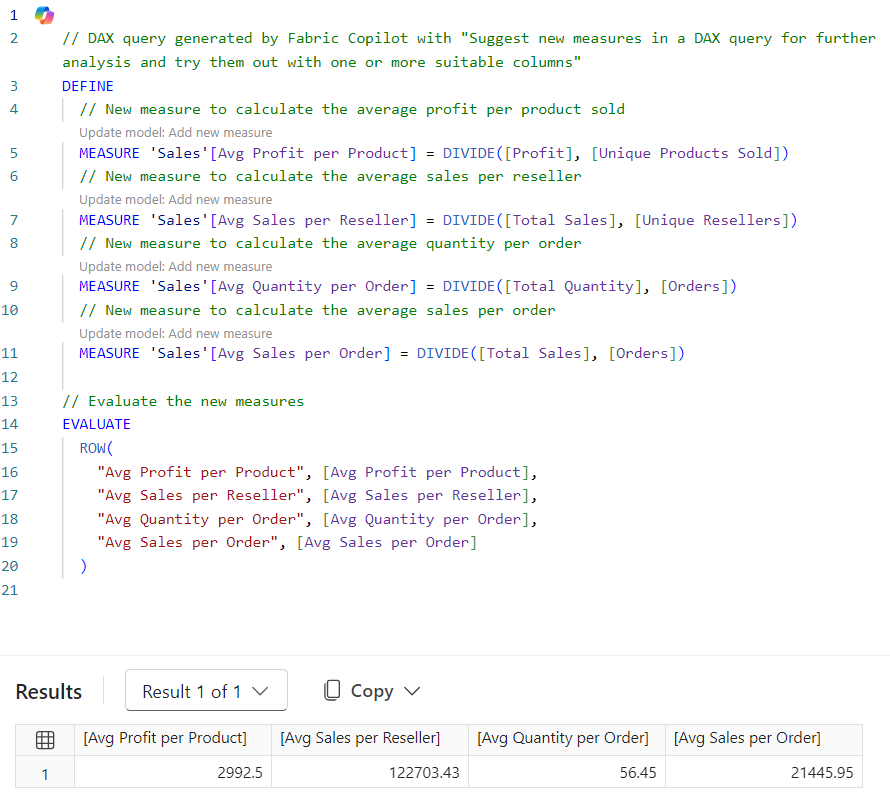
Use Copilot in DAX Query View to explore the data and determine which measures you need to create, and then select Update model with changes to create the measures. The following query was generated from a suggest measures prompt.
// DAX query generated by Fabric Copilot with "Suggest new measures in a DAX query for further analysis and try them out with one or more suitable columns"
DEFINE
  // New measure to calculate the average profit per product sold
  MEASURE 'Sales'[Avg Profit per Product] = DIVIDE([Profit], [Unique Products Sold])
  // New measure to calculate the average sales per reseller
  MEASURE 'Sales'[Avg Sales per Reseller] = DIVIDE([Total Sales], [Unique Resellers])
  // New measure to calculate the average quantity per order
  MEASURE 'Sales'[Avg Quantity per Order] = DIVIDE([Total Quantity], [Orders])
  // New measure to calculate the average sales per order
  MEASURE 'Sales'[Avg Sales per Order] = DIVIDE([Total Sales], [Orders])

// Evaluate the new measures
EVALUATE
  ROW(
    "Avg Profit per Product", [Avg Profit per Product],
    "Avg Sales per Reseller", [Avg Sales per Reseller],
    "Avg Quantity per Order", [Avg Quantity per Order],
    "Avg Sales per Order", [Avg Sales per Order]
  )
And here's the resulting table:
| Avg Profit per Product | Avg Sales per Reseller | Avg Quantity per Order | Avg Sales per Order |
|---|---|---|---|
| 2992.4987 | 122703.4339 | 56.44745575221239 | 21445.9541 |
The following screenshot is the result of three simple steps:
- Enter the suggest measures prompt.
- Select Keep query after results return.
- Run the query.
As a developer, you can Update model with changes to create the measures best suited to your project.
Copilot allows you to explore, design, and enhance semantic models more efficiently, making report development more accessible for all skill levels.