Create reports with Copilot in Power BI
Use Copilot in Power BI to quickly visualize information and uncover insights once your semantic model is prepared. Copilot makes it easier to create compelling, data-driven stories—even if you’re new to Power BI by generating report pages, visuals, and summaries based on your prompts,
Create reports with Copilot in Power BI
Copilot in Power BI helps you build interactive reports faster by turning your ideas into report elements with just a prompt. You can use suggested prompts or enter your own to create new report pages, suggest content, or answer specific data questions in the Copilot pane.
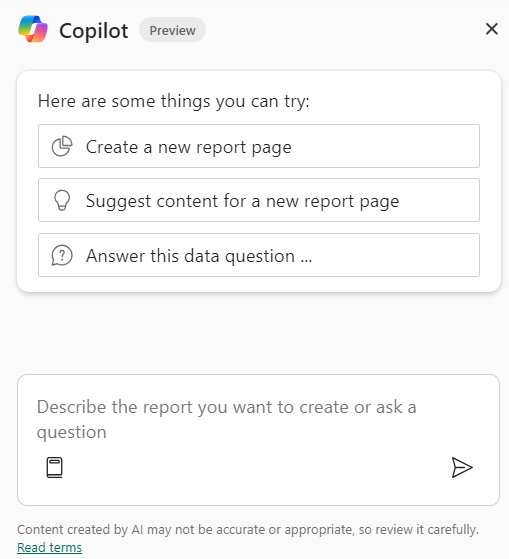
The following example was generated by using the Create a new report page suggested prompt. Copilot asked for the name and description, and then created the report elements, including:
- Header with slicers for product and salesperson.
- Card visuals for the sums of sales, cost, and measure for profit (sales minus cost).
- Area charts evaluating sales, cost, and profit over time.
- Column charts evaluating sales, cost, and profit by product.
- A Map visual for sales by region.

This report and all of the elements were generated in a consistent theme and created quickly. Using Copilot saves time and helps you focus on analysis rather than manual layout and formatting.
Create reports in the Power BI service
When you create reports in Power BI Desktop and publish them, both the semantic model and the report are saved in your workspace. The semantic model contains your data, relationships, and measures, while the report is the visual layer you design.
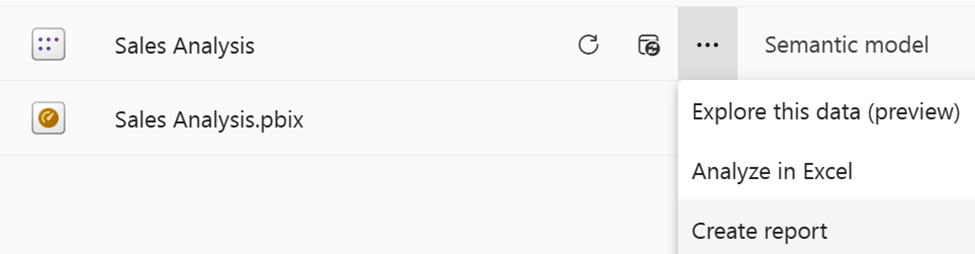
Copilot can also help create reports based on semantic models in the Power BI service. To get started, select the ellipsis (...) next to your semantic model and choose Create report.
For this example report, we see several different possibilities offered, including:
- Sales Performance by Salesperson
- Regional Sales Analysis
- Product Cost and Profitability
In the following screenshot, we selected the Product Cost and Profitability prompt to generate a new report page. This page has a similar layout from the one created with Power BI Desktop. There are Card visuals, Bar and Column charts, and Area charts to help analyze the cost and profitability of different products, including standard cost, profit, and profit margin.

Create pages with custom prompts
You can also provide your own prompt based on your knowledge of the data and business requirements for the report. There might be limitations to what Copilot can create based on your prompt. Some ideas for our model are:
- Create a page that shows the top 10 products by sales.
- Create a visual on a new page that shows the top three colors across all products sold.
Tip
For more information, see Write Copilot prompts that produce results in Power BI.
Summarize report insights with Copilot
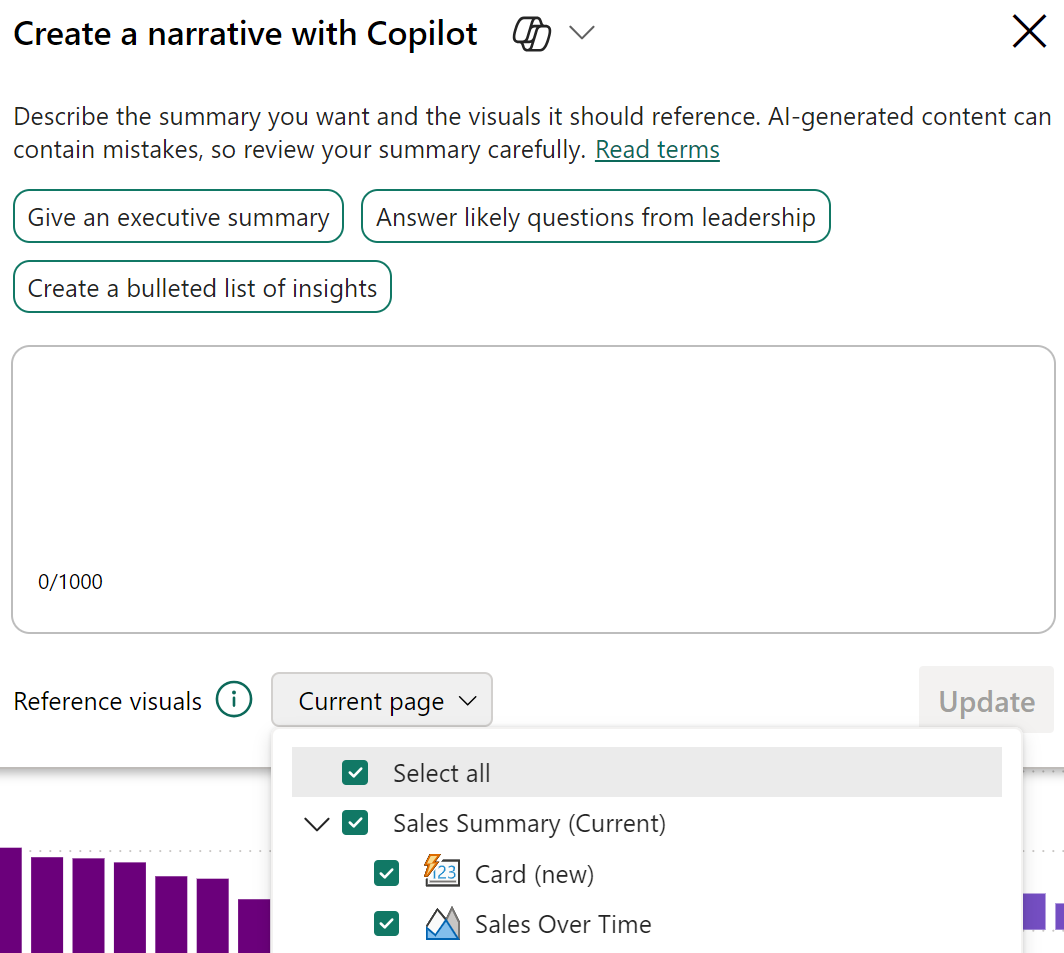
Copilot can also help you communicate key findings by generating narrative summaries of your report data. Whether you’re preparing an executive summary or answering likely questions from leadership, Copilot’s summaries help keep your audience engaged and informed. Use the Narrative visual or Copilot pane to create summaries with suggested or custom prompts, referencing all visuals on a page or only selected ones.
- Example prompts:
- Give an executive summary
- Answer likely questions from leadership
- Create a bulleted list of insights
In the following screenshot, the Copilot-generated summary, some of the highlighted points are:
- Highest and lowest sales across products.
- A significant spike in sales.
- Overall profit and highest profit on a single day.

These details offer insights at a glance while the whole report offers interactive visuals for further analysis.
Tip
Review the Copilot in Power BI documentation for other prompt ideas.
Summarize in the Copilot pane
Both developers and consumers can use the Copilot pane to summarize or answer questions about the report. Copilot considers all data, including data hidden behind filters or slicers that aren't currently applied. You can specify the scope (entire report or current page) in your prompt.
Important
Copilot responses might vary and can contain errors. Treat Copilot-generated content as a first draft and always review before completing development.