Note
Access to this page requires authorization. You can try signing in or changing directories.
Access to this page requires authorization. You can try changing directories.
We're excited to announce the availability of Visual Studio 2026 Insiders. This release marks the beginning of a new era for Visual Studio with deep platform integration of AI, stronger fundamentals, and improved performance.
Download Visual Studio 2026 Insiders to enjoy these new features and improvements.
Features
Released on September 9, 2025.
Productivity
Adaptive paste
Let Copilot intelligently adjust your pasted code to seamlessly fit the context of your existing code - no more manual tweaking required!
When you're pasting code into Visual Studio, there are often additional steps required to make it work seamlessly. Parameters may need to be adjusted to match those already used in your solution, or the syntax and styling may not align with the rest of your document.
Adaptive paste is here to save you time and reduce effort by automatically adjusting the pasted code to fit the context of your existing code, minimizing the need for manual modifications. This feature also supports scenarios such as minor error fixes, code styling, formatting, human and code language translation, and fill-in-the-blank or continue-the-pattern tasks.
For instance, if you have a
Mathclass that implements theIMathinterface, copying and pasting the implementation for theCeilingmethod into the same file will adapt it to implement the not yet implemented interface memberFloor.
Adaptive paste is also helpful for programming language translation. See the example below where Copilot automatically helps translate the code from C++ to C#.
The adaptive paste UI will appear when you perform a regular paste {KeyboardShortcut:Edit.Paste}. Simply press the
TABkey to request a suggestion, and you'll be shown a diff comparing the original pasted code with the adjusted code.You can also trigger adaptive paste by first copying the relevant code and pressing Shift+Alt+V to paste it. This will automatically show the adaptive paste suggestion without needing to press
TAB. You can also go to Edit → Paste Special → Paste with Copilot to trigger adaptive paste.
Adaptive paste is now generally available in Visual Studio and automatically enabled for all users. Give it a try today! You can also change the option in Tools → Options → GitHub → Copilot → Editor → Enable Adaptive Paste.

Code actions at your fingertips 📣
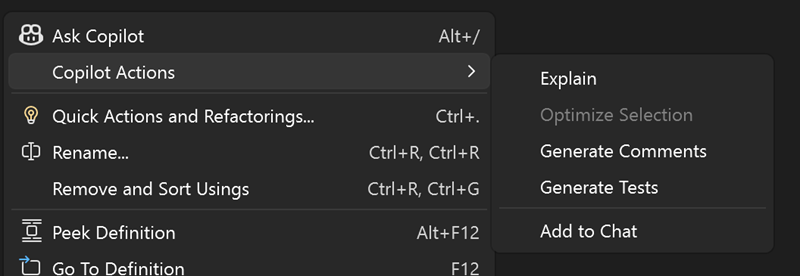
Get quick help from Copilot with a single right-click from your context menu in Visual Studio.
We are excited to announce that you can now interact with Copilot directly from your context menu in Visual Studio! This new feature lets you quickly get help from Copilot for common tasks with a single click, without needing to type any prompts.
Currently, there are five Copilot actions available in the context menu, each working differently depending on whether you have code selected:
Try out these Copilot actions and let us know what you think! We would love to hear your feedback and any suggestions for other actions you would like to see in the context menu.
📣 See feature ticket to share your feedback and continue the conversation.
Mermaid chart rendering 📣
Rendering Mermaid charts in both the Markdown editor and Copilot Chat.
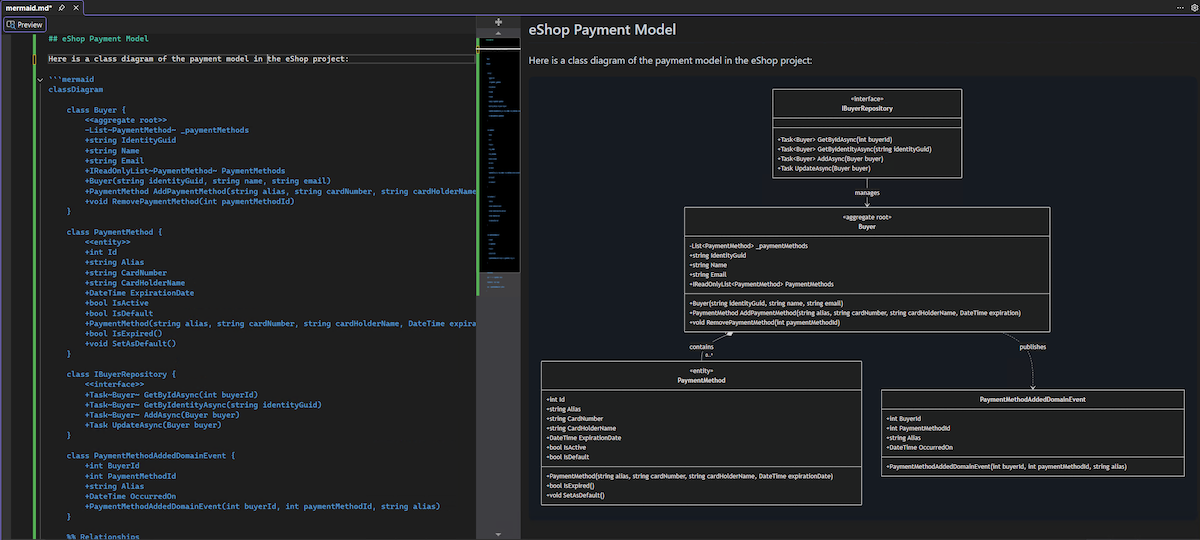
We are excited to announce that Visual Studio now supports rendering Mermaid charts in the Markdown editor, where you can provide your own Mermaid syntax or have Copilot generate it for you! This new feature lets you visualize complex data structures and workflows directly within your code editor. For example, you can create flowcharts and diagrams in a Markdown file using Mermaid syntax, and they will be automatically rendered in the preview.
If you have Mermaid syntax ready in a Markdown file, you can preview it by clicking the Preview button in the top left corner of the editor. The Mermaid chart will be rendered in the preview pane, allowing you to see the visual representation of your data.
You can also ask Copilot Chat to generate charts and diagrams to help explain complex codebases or logic with visual aids. Copilot will respond with the generated Mermaid syntax, which you can preview directly to view the rendered diagram.
Please give it a try and generate a Mermaid chart today! We would love to hear your feedback and any suggestions for improving this feature.
📣 See feature ticket to share your feedback and continue the conversation.

Enhanced editor controls 📣
Discover advanced options for maximizing your editing experience with new margin capabilities.
Developers rely on subtle cues and quick context to stay in flow, and the editor's bottom margin is a key part of that. But until now, it offered limited insight and little flexibility - leaving useful information just out of reach.
We've upgraded the bottom margin to be more informative and customizable. Line, column, and character position are now unified into a single display - and clicking it opens the Go To Line dialog for faster navigation. When working with multiple selections, you'll see total counts for selections, characters, and lines. Hovering over the selection margin reveals detailed info per selection.
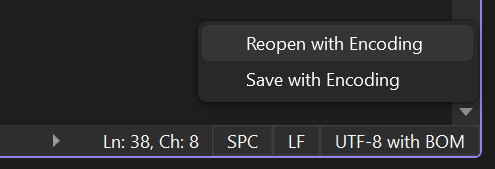
File encoding is now displayed in the margin for quick reference. You can also save or reopen a file using a specific encoding, which helps ensure proper display of special characters, supports multiple languages, and maintains consistent readability across systems.
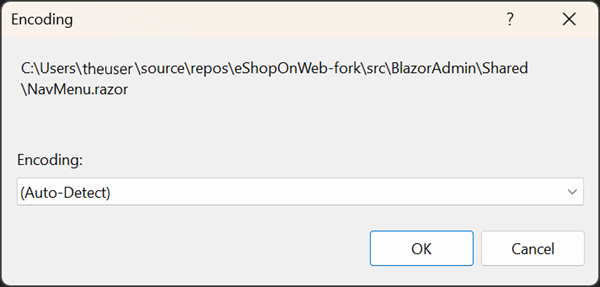
Clicking the encoding margin opens a context menu where you can choose to save or reopen the file. Selecting an option will launch an encoding dialog with a dropdown list of available encodings to choose from.
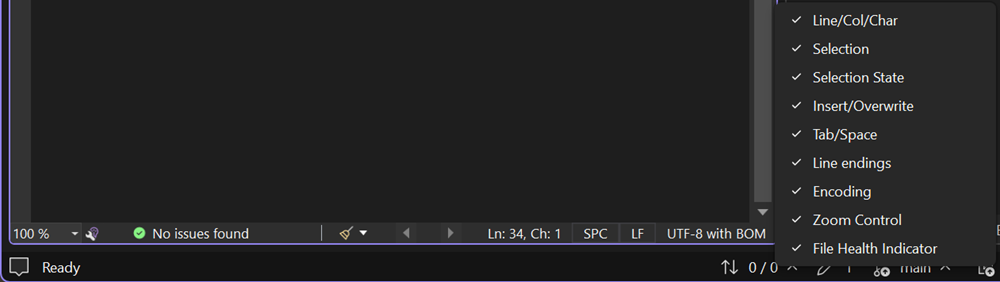
A new context menu has been added to the margin, giving you full control over what information is shown. This menu includes all the bottom margins in the editor, from the Zoom control all the way to the new encoding margin.
You can manage these settings through Tools → Options → Text Editor → General → Display → Show editing context in the editor. For quicker adjustments, right-click the bottom margin to open the new context menu and change what's shown without leaving your flow. You can manage these settings through Tools → Options → Text Editor → General → Display → Show editing context in the editor. For quicker adjustments, right-click the bottom margin to open the new context menu and change what's shown without leaving your flow.
📣 See feature ticket to share your feedback and continue the conversation.

File exclusions in search 📣
Skip the noise by excluding files you never need to search.
Some files you just never need to look through. Whether it's build artifacts, minified scripts, or generated files, they clutter your search results and slow you down.
You can now exclude them from your searches in Find in Files and Quick Find to focus on what matters.
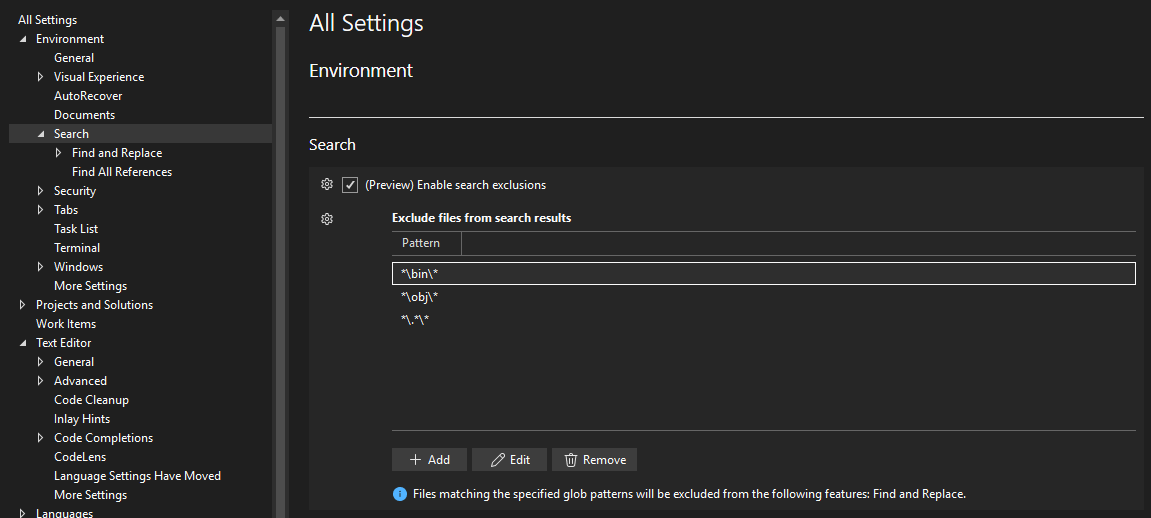
To set it up, go to Tools → Options → Environment → Search, and look for the new Exclude files from search results section. There, you can add, edit, or remove glob patterns to control exactly which files are left out of your search results.
These exclusions are automatically applied in Quick Find.
For Find in Files, these exclusions are applied in addition to your existing selection in the File types. You can choose to easily toggle the settings level exclusions on or off via the toggle button on the right of the File types.
📣 See feature ticket to share your feedback and continue the conversation.

GitHub Copilot
Bring your own model to chat
You can now connect your own language models to Visual Studio Chat, giving you more choice, control, and customization over your AI experience.
You can now connect your own language models to Visual Studio Chat, giving you more choice, control, and customization over your AI experience.
Use API keys from Anthropic, Google, or OpenAI to try the latest releases, run models that meet your security or performance needs, and switch easily between built-in and custom options.
Getting started:
- Open the Chat Window → Select Manage Models from the model picker > add your provider and key.
Available for Chat only. Not supported for Copilot Business or Enterprise. Model capabilities vary.
More providers and features are coming soon, helping you build with the AI that works best for you.

Important
Activate GitHub Copilot Free and unlock this and other AI features. No trial. No credit card. Just your GitHub account.
Copilot URL context
Paste a URL in Copilot Chat to pull in page content for better answers.
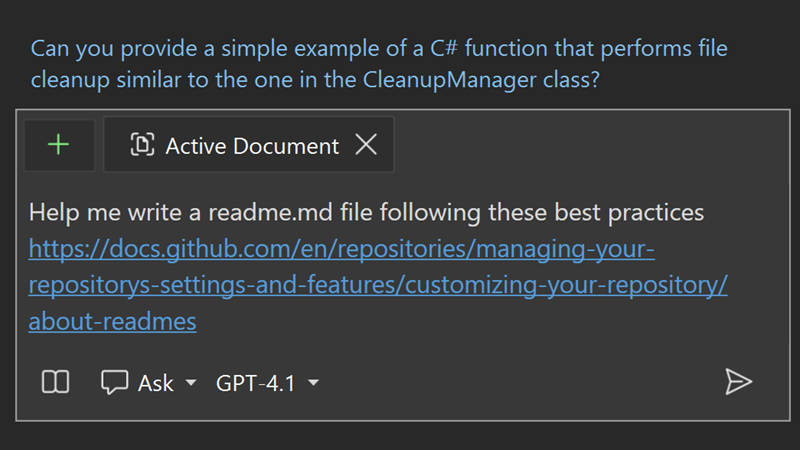
Ever felt stuck when a topic doesn't seem covered in Copilot's training data? Now you can reference URLs in Copilot Chat to provide more context for your questions, helping Copilot give you better responses.
Reference URLs in your questions
Pasting a URL in the prompt box allows Copilot to pull information from the web. This helps fill in the blanks when Copilot's training data doesn't cover a topic or when you want to reference a specific resource.
For example, you can ask Copilot to help you write a readme.md file based on best practices on GitHub.
One limitation to keep in mind is that Copilot can only reference the content of the public URL you provide. It won't be able to access any other resources or links on that page or pages behind authentication. Additionally, it can only pull in static HTML content, so if you reference a dynamic page, Copilot won't be able to access the content.
Important
Activate GitHub Copilot Free and unlock this and other AI features. No trial. No credit card. Just your GitHub account.
Better Copilot responses 📣
Experience dramatically improved Copilot responses with enhanced context for code search, external symbol understanding, and precise line number referencing!
Copilot Chat keeps getting smarter with improved context for your everyday tasks! You can expect better results when searching your codebase, understanding dependencies with external symbols, and referencing specific lines in your code.
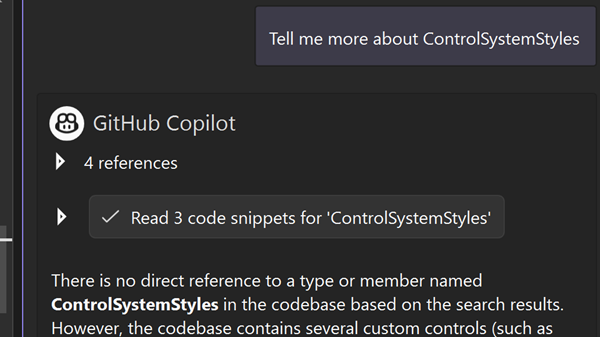
Improved code search
Copilot Chat's code search capabilities have been enhanced to provide more relevant results. This means you get more accurate suggestions because Copilot is even better at retrieving the right code snippets related to behaviors, concepts, or functionality described in natural language. These improvements are thanks to leveraging remote indexes of your codebases.
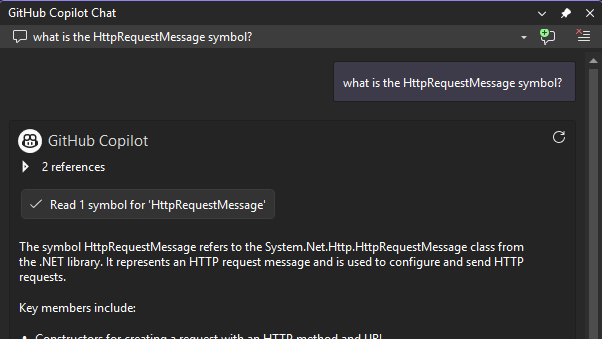
Awareness of external symbols
Now Copilot Chat can extend beyond your project to help you with external symbols brought in by your dependencies in C#. With this broader scope of understanding, it can provide you with more effective solutions for your projects.
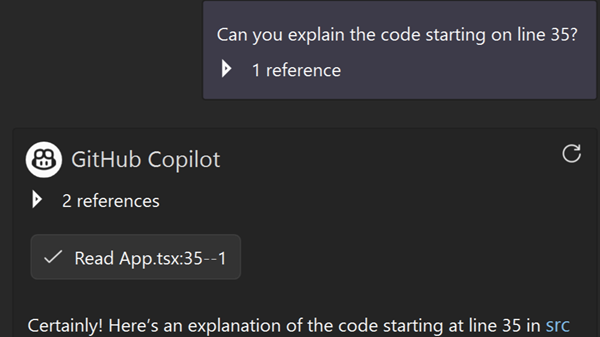
Better accuracy with line numbers
When you reference a specific line in your code, Copilot Chat will now provide more accurate responses. This means that when you ask Copilot to look at a certain section of the code in natural language, it will be able to give you more precise information.
📣 See feature ticket to share your feedback and continue the conversation.
Important
Activate GitHub Copilot Free and unlock this and other AI features. No trial. No credit card. Just your GitHub account.
Debugging & diagnostics
Profiler Copilot Agent 📣
An AI profiler agent that analyzes performance, suggests fixes, and helps you iterate fast.
We are excited to introduce the Profiler Agent in Visual Studio: an AI assistant that helps you understand and fix performance issues without needing to be a profiling expert.
The Profiler Agent works alongside GitHub Copilot to:
- Analyze CPU usage, memory allocations, and runtime behavior
- Surface performance bottlenecks
- Generate new BenchmarkDotNet benchmarks or optimize existing ones
- Suggest and help apply optimizations
- Validate improvements in a guided loop
Getting started is simple. Just ask your question in Copilot Chat (Agent Mode):
- Option 1: Tag @profiler
Example: @profiler Why is my app slow?- Option 2: Ask directly without tagging (enable the Profiler Agent in the Select Tools menu)
Example: Why is my frame rate dropping?
Whether you're new to profiling or a pro, this experience puts AI driven diagnostics at your fingertips. No deep knowledge required — just actionable insights.
Currently supports high CPU usage analysis and .NET object allocations, with more scenarios coming soon.
📣 See feature ticket to share your feedback and continue the conversation.
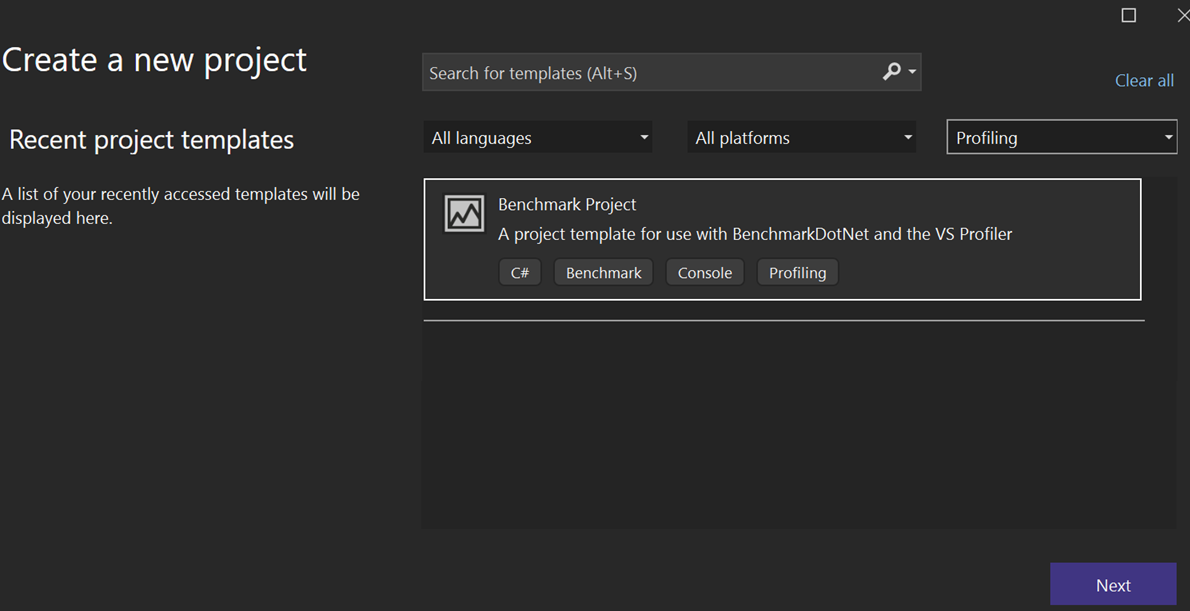
BenchmarkDotNet project template
Accelerate performance tuning with the new Benchmark project template and built-in profiling support - get insights faster than ever!
Introducing a powerful new way to jumpstart performance benchmarking in Visual Studio - a fully integrated BenchmarkDotNet project template with built-in support for CPU Usage profiling and Copilot insights.
Add a new project in Visual Studio and select BenchmarkDotNet Project from the Profiling category. Pick your target .NET version and the template aligns automatically.
Visual Studio scaffolds a fully configured project, complete with benchmark setup and CPU diagnosers.
Once you run your benchmarks, the profiler automatically launches a diagnostics session and you can instantly view CPU usage, call tree data, and performance hot paths - with optional Copilot insights - without leaving your IDE.
CMake diagnostics just leveled up
Profile CPU, analyze File IO, and trace events - now fully supported for CMake projects.
CMake projects now get native support for CPU Usage, Events Viewer, memory usage and File IO tools in Visual Studio - no workarounds, no extra setup. The CPU Usage tool also includes Copilot-powered performance insights, helping you detect and resolve bottlenecks even faster.
Tailored for game developers and performance-critical workflows, this update lets you:
- Identify performance bottlenecks and optimize compute-heavy code with CPU Usage Tool.
- Track runtime events like exceptions, logs, and HTTP requests with Events Viewer.
- Analyze file access patterns, durations, and throughput with File IO Tool.
Optimize zero-length array with Copilot
Turn zero-length array insights into action with intelligent Copilot assistance in the .NET Allocation Tool - optimize your memory usage like never before!
The .NET Allocation Tool now integrates Copilot assistance for zero-length array allocations, giving you intelligent, actionable guidance right where you need it most!
When you run the .NET Allocation Tool, the Insights tab will highlight zero-length array allocations - a subtle but often overlooked source of unnecessary memory churn.
Alongside the insight description, you'll see the Ask Copilot button. Click it and Copilot will deliver a detailed analysis of the allocation patterns and suggest concrete code fixes to optimize your memory usage - just like the Copilot auto-insights you already love in the CPU Usage tool!
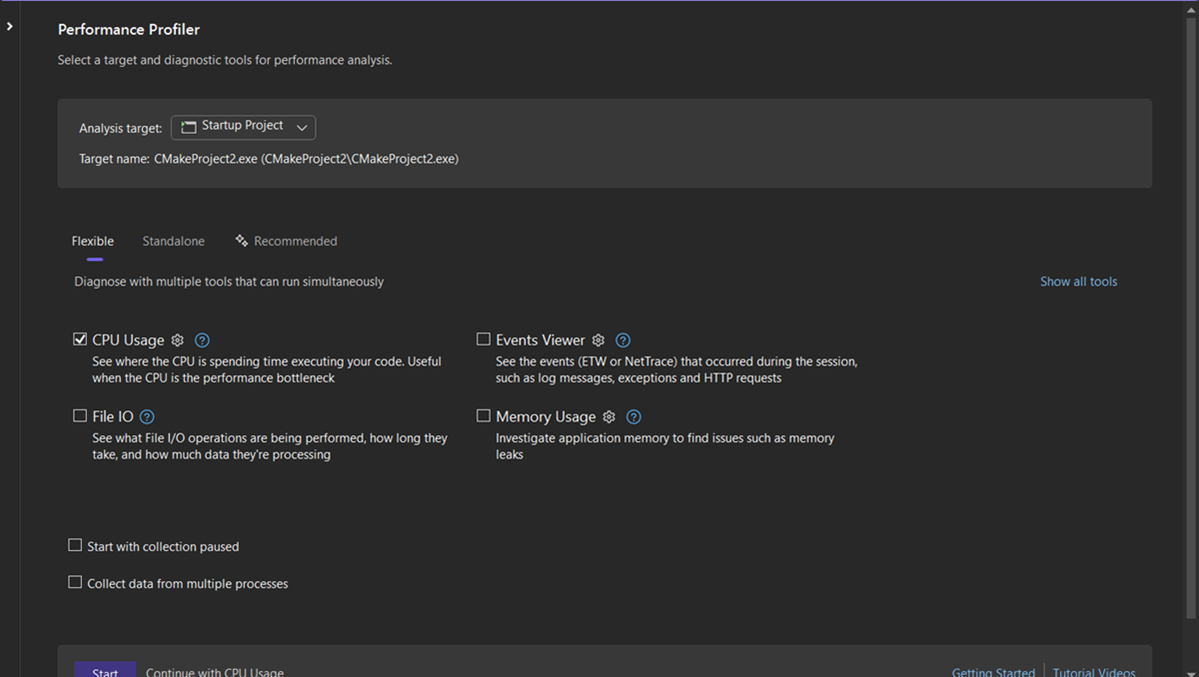
New Profiler launch experience
A cleaner launch page with smarter tool combos and Copilot recommendations.
We've revamped the Profiler Launch Page to make it faster, clearer, and smarter to pick the right tool for your performance investigation.
The redesigned interface has a clean layout with a clear distinction between tools that can run together and those that must run alone—so you always know what's compatible.
Copilot integration provides context-aware recommendations right on the page, helping you choose the best profiler for your scenario. If the default suggestions don't fit, just describe your issue in plain English and Copilot will guide you.
Whether you're new to profiling or a seasoned developer, this upgrade makes it easier to improve your app's performance.
Inline post-return values
Debug smarter with inline post-return values and Copilot insights.
Visual Studio debugger now displays inline post-return values, showing the actual return values of functions at the point where they're used. This gives you real-time visibility into function behavior without stepping into code or setting up watches, making it faster to catch logic issues or unexpected results.
You can customize what is shown via the right-click context menu, choosing to display returning, returned, or both types of inline values based on your preference.
With GitHub Copilot integration, you can hover over a value and use Ask Copilot to analyze unexpected results, uncover potential root causes, or get suggestions on how to fix issues all without breaking your flow.


Search in Text Visualizer 📣
Quickly find text inside long strings while debugging.
You can now search within string values in the Text Visualizer using the new Quick Find feature! Simply press Ctrl+F while the visualizer is open to bring up the search box. Your search terms will be highlighted throughout the string, making it easier to spot important text, errors, or patterns.
Need to read content behind the search box? Hold Ctrl and the search UI becomes transparent, so you never lose sight of the data underneath.
This makes navigating long strings like logs, JSON blobs, or error messages faster and more intuitive during debugging.
📣 See feature ticket to share your feedback and continue the conversation.

Git tooling
Inline pull request comments
You can now view pull request comments directly in the diff view and see them rendered with Markdown formatting - making feedback easier to read and understand in context.
The pull request experience in Visual Studio just got better.
Inline comments in pull request diff view
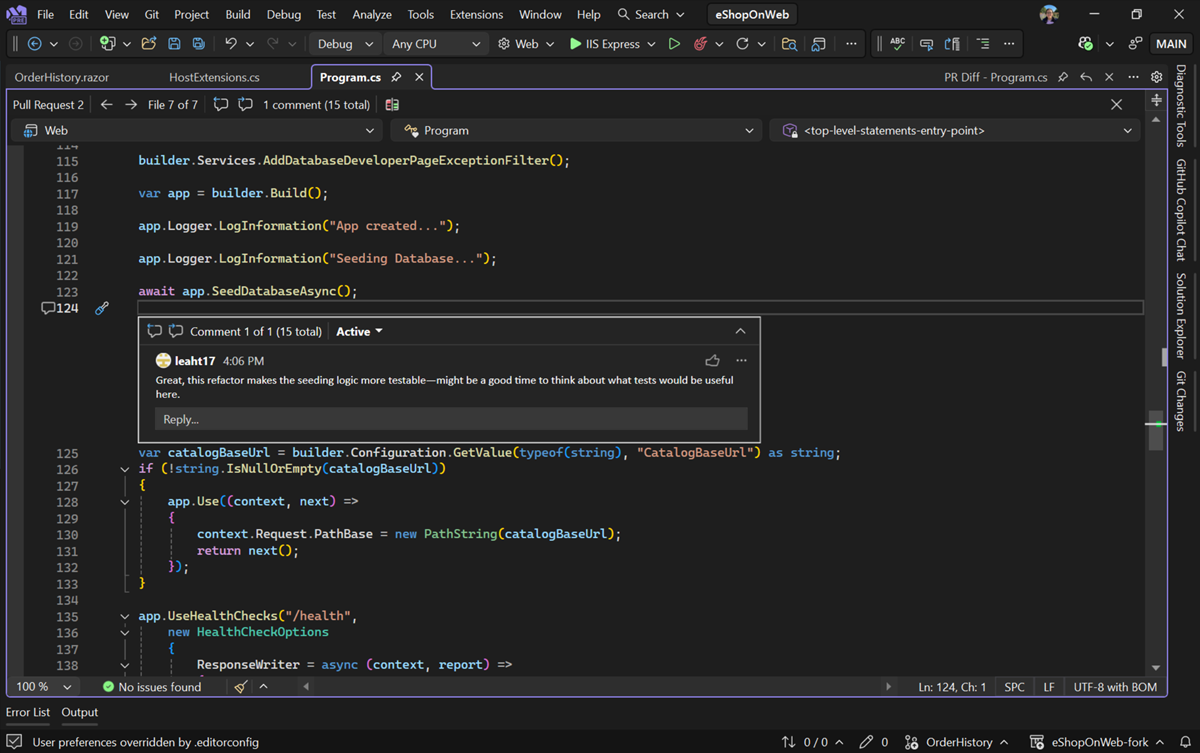
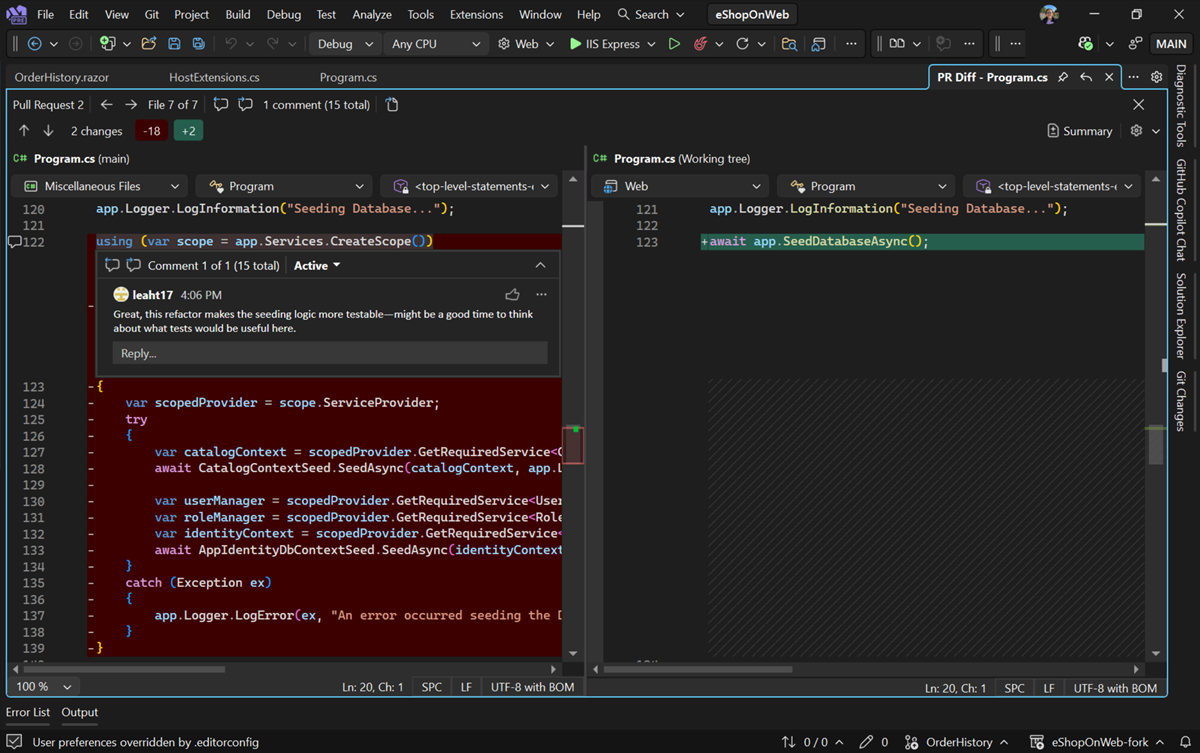
By default, your pull request comments appear in the working file view. You can now also see them in the diff, which lets you view the full picture of the changes.
In the diff view, you can see comments alongside the original and updated code. This makes it easier to see exactly what was changed and why. You can also edit the working file directly in this view.
For example, if a comment suggests adding tests after refactoring, seeing the original code in the diff helps you understand which functionality was moved. Having the original code right there in the diff helps you make sense of the comment faster - no need to go hunting for where the method was moved.
Comments in the diff are supported across different file types, including
.csfiles. Support is expanding, so if you notice comments not appearing in the diff for a particular file type, please report the issue.Markdown rendering support in pull request comments
Comments now render using Markdown formatting, making it easier to read and format your feedback.
Try it out
Enable this feature via Tools → Options → Preview Features → Pull Request Comments.
Better code reviews AI 📣
Get better GitHub Copilot-powered suggestions for your code changes to help you catch potential issues early and improve your code quality.
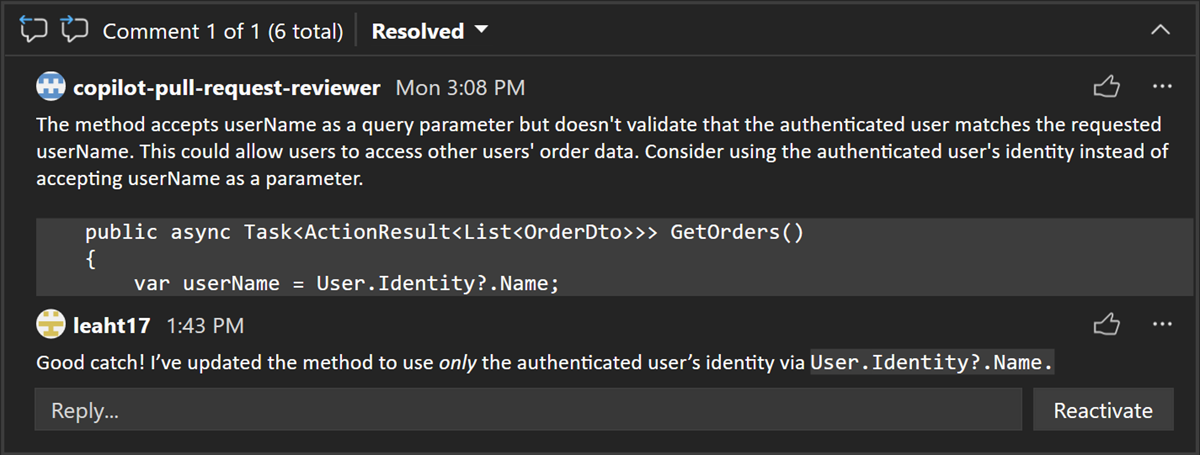
Now, with the latest model updates, you can get even better code review comments on your local changes before you even commit!
Same UX with key improvements
Enhanced Comment Quality - newer reasoning models mean more insightful and precise code reviews, catching subtle bugs and performance issues that might be overlooked by traditional methods.
Optimized Comment Generation - by generating comments for the entire change set at once, rather than file-by-file, you get improved performance and a more comprehensive review.
Updated Prompting Techniques - clearer and more direct prompt ensures more accurate and relevant feedback.
Get started
With your Copilot subscription enabled in Visual Studio and the following feature flags enabled, you can see the new sparkle comment button in the Git Changes window. When clicked, Copilot will examine your sets of changes and propose some suggestions inline in your editor.
Ensure you have both of the following feature flags turned on:
- Tools → Options → Preview Features → Pull Request Comments.
- Tools → Options → GitHub → Copilot → Source Control Integration → Enable Git preview features.
📣 See feature ticket to share your feedback and continue the conversation. And take this survey to help make the feature even better.
Note
This feature must be enabled under Tools → Manage Preview Features
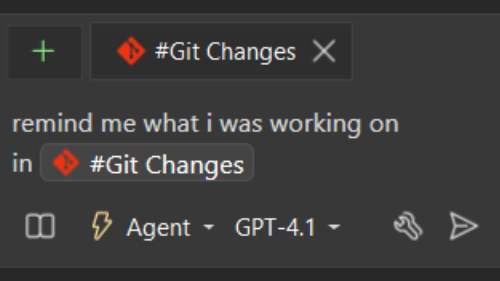
Git context in Copilot Chat
Reference your commits and changes in Copilot chat.
Copilot Chat now supports referencing your commits and changes in the Git Changes window. You can ask Copilot to summarize your changes, explain a specific commit, and more!
Reference your changes
#changeslooks at your uncommitted changes. For example, you can ask Copilot to remind you of what you've done so far by referencing your#changes.
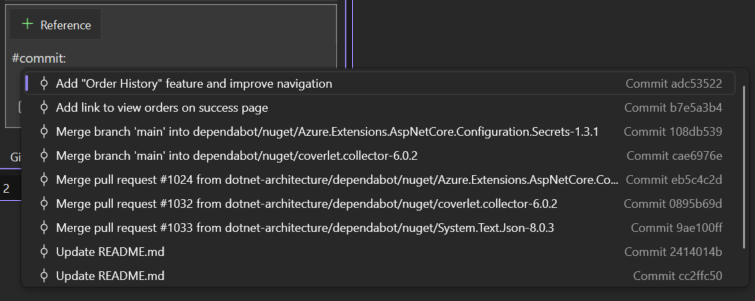
Reference your commits
When you start typing
#commit:, Copilot will pull up a list of the most recent commits for you to select from. If there's an older commit you want to reference, you can also reference its specific commit id.
Then you can ask the chat to use the commit for tasks like write unit tests to cover changes in this commit or find potential issues in this commit.
Try this out
Ensure the following feature flag is turned on to be able to use these references: Tools → Options → GitHub → Copilot → Source Control Integration → Enable Git preview features.
IDE
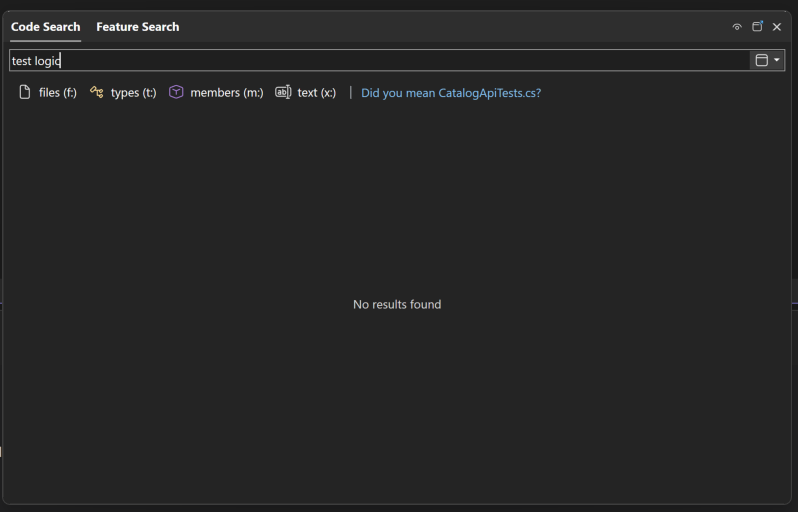
Did you mean? 📣
Never lose track of files again! Copilot intelligently detects your intent and suggests better matches when you search in Visual Studio.
Ever forget the name of a file while coding? The new Did You Mean feature in Visual Studio is here to help! When you search using All-In-One Search and Copilot detects a better match than the top result - perhaps because of a typo or a fuzzy memory - it will suggest what you might have meant.
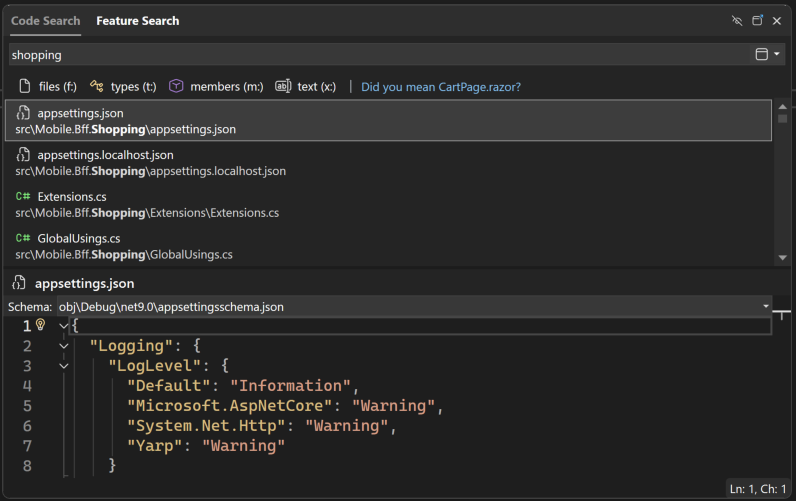
Did You Mean works seamlessly with All-In-One Search, which you can access by pressing Ctrl+Shift+P. When you type a search term, Copilot analyzes your input and suggests a more relevant term if it finds one that more closely matches your intent. This feature helps whether the search results are empty or when the top result isn't what you intended.
Did You Mean speeds up your search experience by reducing the time spent correcting typos or trying to remember the correct name - making your search experience easier and more intuitive!
Did You Mean (preview) is now available in Visual Studio and automatically enabled for all applicable users. Currently, this feature works with public GitHub repositories, and we're actively working to expand its reach in future updates. Give it a try today and let us know what you think! You can also change the option in Tools → Options → GitHub → Copilot → Search → Enable 'Did You Mean' code search support in All-In-One Search (preview).
📣 See feature ticket to share your feedback and continue the conversation.
Code coverage 📣
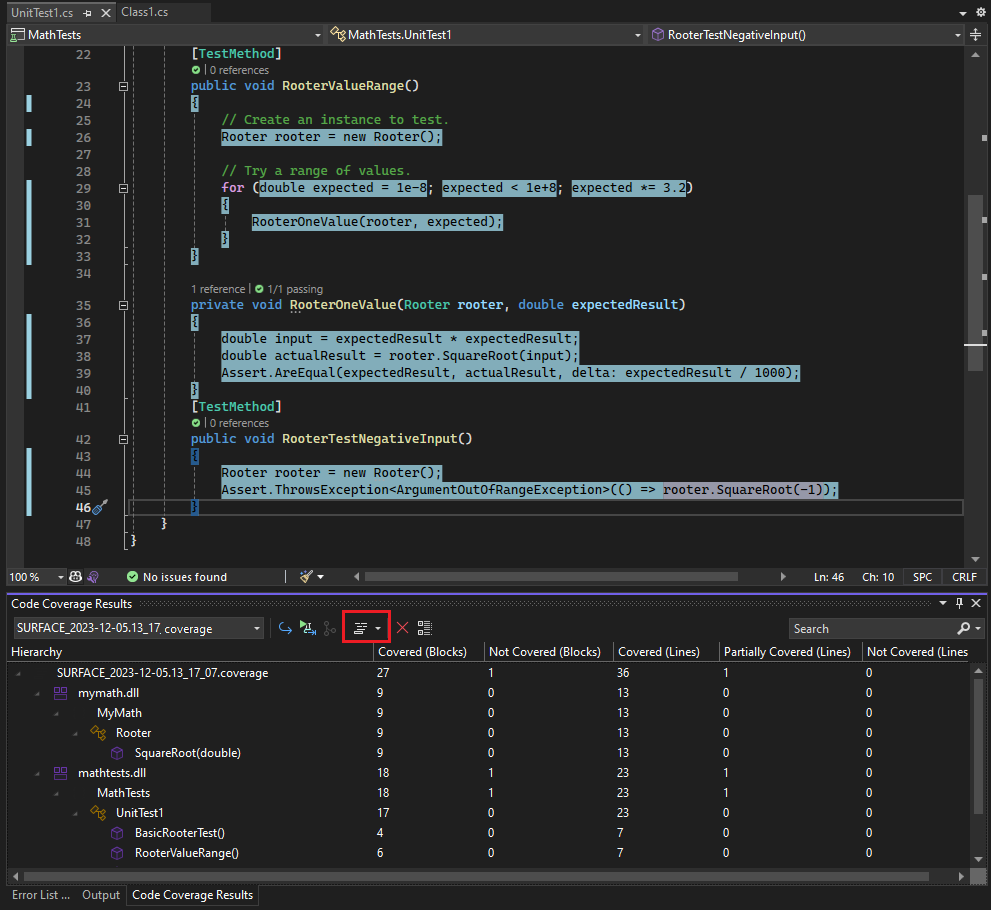
Code coverage is now available in Visual Studio Community and Professional editions for the first time - ensuring your code is well-tested has never been easier!
You can now analyze which parts of your code are exercised by tests directly from within the IDE! This feature was previously only available in the Enterprise edition, but is now available in Community and Professional editions, making it easier than ever to ensure your code is well-tested.
🧪 What's New
- Built-in code coverage tools help you understand test effectiveness by showing how much of your code is covered by unit tests and other coded tests.
- CI/CD integration allows automated coverage tracking as part of your continuous integration workflows.
🚀 How to Use It
- From the Test menu, select Analyze Code Coverage to run coverage on your test suite.
- You can also right-click within the Test Explorer to run code coverage for selected tests.
- Results will appear in the Code Coverage Results window, showing percentages for each assembly, class, and method.
- Visual Studio highlights tested lines directly in the editor, so you can quickly spot what's covered and what's not.
This feature brings a crucial tool to more developers, helping you ship with greater confidence.
📣 See feature ticket to share your feedback and continue the conversation.
New look and feel 📣
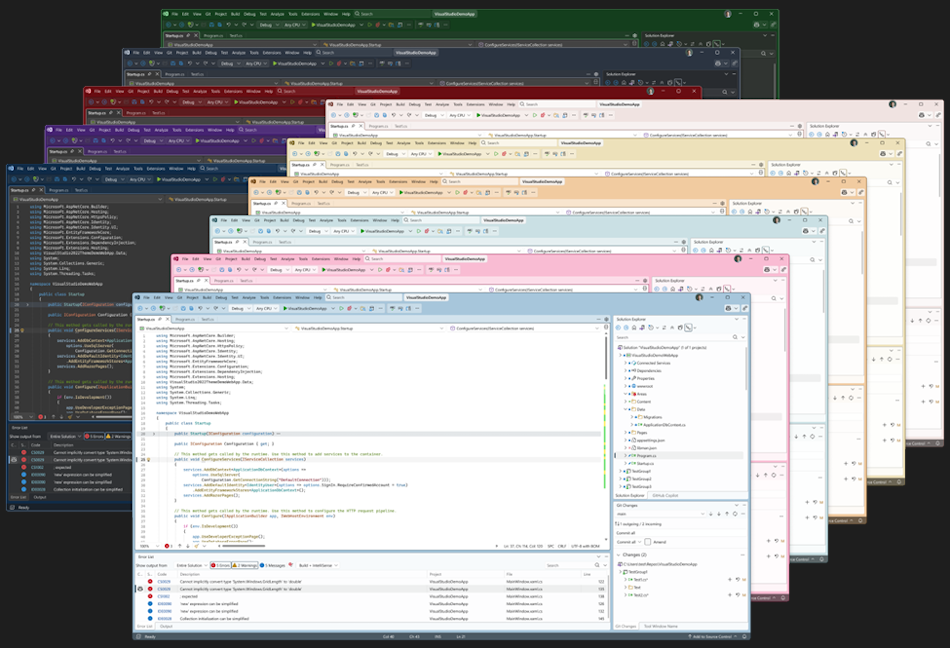
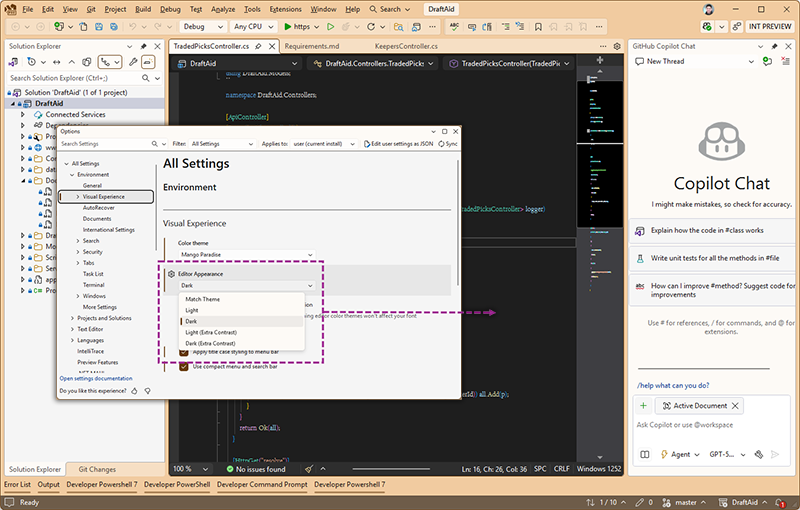
Visual Studio now features a refreshed interface aligned with the Fluent UI design system. This update introduces a modern, cohesive aesthetic across the IDE, improving usability, accessibility, and visual clarity.
The Visual Studio IDE has been updated to align with the Fluent UI design system, delivering a more modern and cohesive look and feel. These changes enhance usability and accessibility while preserving familiar workflows.
In addition to the updated design language, we've introduced 11 new tinted themes to give users more control over the appearance of their development environment.
We're also introducing a new Editor Appearance setting that focuses specifically on the editor's look and feel. This setting can be used to match the overall IDE theme, but it also works independently, allowing users to customize their coding environment without needing to align with the broader IDE.
Finally, we've redesigned the iconography to be more visually appealing and easier to recognize, improving navigation and overall user experience.
📣 See feature ticket to share your feedback and continue the conversation.
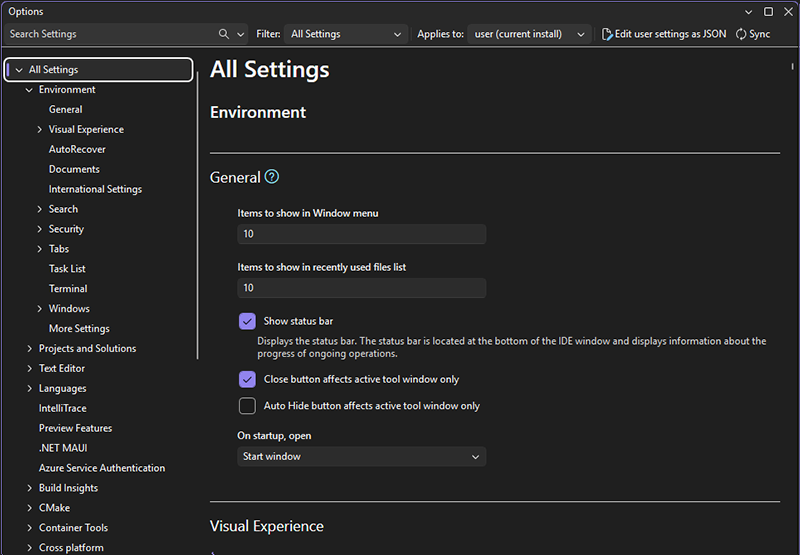
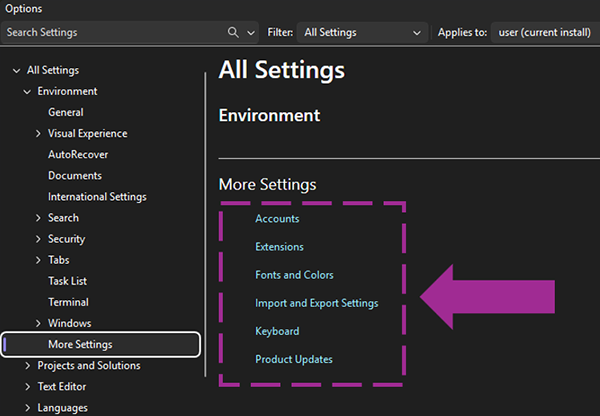
Modern settings experience 📣
The new settings experience brings a streamlined, user-friendly interface to Visual Studio, replacing Tools > Options with a modern design, smarter organization, and enhanced reliability.
The modern settings experience is now the default, replacing the legacy Tools → Options dialog. This updated platform introduces a Fluent-aligned UI, centralized registration, and improved persistence bringing clarity, consistency, and extensibility to your configuration workflow.
Roaming support will carry forward your settings from older Visual Studio versions. However, unlike previous releases, settings will no longer sync back to older products - ensuring forward compatibility and a cleaner migration path.
While most of the most-used settings have already transitioned to the new platform, remaining settings are still accessible via legacy links. This ensures continuity while encouraging full onboarding to the new experience.
📣 See feature ticket to share your feedback and continue the conversation.
Cloud
Cloud Services (extended support) deprecation
Important information about the upcoming Cloud Services (Extended Support) retirement and migration guidance to help you prepare.
On March 31, 2027, the Cloud Services (Extended Support) deployment model will be retired. As a result, the supporting Cloud Services tooling will not be available in the latest Visual Studio after this date.
Cloud Services (Extended Support) tooling will continue to work in Visual Studio 2022 with general maintenance occurring until March 31, 2027. We recommend starting your migration planning now to ensure a smooth transition.
See the official announcement for more information, including detailed guidance on migrating your apps to modern Azure services.
Service Fabric tools update
Service Fabric tools move out of the box-install them as a VS extension.
The Service Fabric tools will no longer be included in Visual Studio. Instead, install the Service Fabric Tools for Visual Studio extension from the Visual Studio Marketplace, which will be available soon.
.NET
.NET 10 and C# 14
Support for .NET 10 and C# 14 is baked in so you can take advantage of the latest features and improvements in your projects.
We're excited to bring you full support for .NET 10 and C# 14 in this latest version of Visual Studio! This means you can immediately start taking advantage of all the newest language features, performance improvements, and framework enhancements without any additional setup or configuration.
The integration is seamless - simply create a new project targeting .NET 10 or update your existing projects, and you'll have access to all the latest C# 14 language features right in the editor. IntelliSense, debugging, and all your favorite productivity tools work perfectly with the new syntax and APIs. Whether you're building web applications, desktop apps, or cloud services, you can leverage the cutting-edge capabilities that .NET 10 brings to the table.
Visual Studio's compiler and tooling have been updated to provide full support for C# 14's new language constructs, ensuring you get accurate syntax highlighting, error detection, and code completion. This tight integration means you can be confident that your development experience will be smooth and productive as you explore what's possible with the latest version of the .NET platform.
Ready to get started? Create a new project and select .NET 10 as your target framework, or upgrade your existing projects to begin using these exciting new capabilities today!

Hot Reload improvements
Faster, more reliable Razor Hot Reload with auto-restart support for rude edits.
Improved Hot Reload performance & reliability for Razor files
Thanks to co-hosting the Razor compiler inside the Roslyn process, editing a .razor file during Hot Reload is much faster and more efficient (addressing prior feedback where Blazor Hot Reload could take tens of seconds). This change also should increase overall reliability when using Hot Reload.
To enable co-hosting go to Tools → Options and search cohost, which should show the feature Use Roslyn Cohost server (requires restart). After enabling this, it's recommended to restart Visual Studio to ensure it's enabled.
Fewer blocked edits (reduced 'rude edits')
We've expanded what code changes are allowed during Hot Reload. Several edits that previously triggered a rude edit (changes that require a rebuild and restart) are now applied seamlessly. Some examples of edits that are no longer a rude edit includes:
- Renaming a file
- Editing code that has lambdas with default parameter values
- Editing property accessors with the field keyword
Auto-restart on 'rude edits'
Hot Reload can now automatically restart the app's process when an unsupported change ('rude edit') is made, instead of ending the entire debug session. To enable this, edit your project file to contain this property declaration
<PropertyGroup>
  <HotReloadAutoRestart>true</HotReloadAutoRestart>
</PropertyGroup>
You can also set this in a Directory.Build.props file. This streamlined auto-restart kicks in for project types where a quick process restart is feasible (e.g. certain Aspire or web projects), so you can continue debugging with minimal interruption.
This is a process-based restart. If you are debugging 4 projects, only the changed project(s) (and any dependent project) will get rebuilt and restarted.
Razor editor improvements
Faster and smarter Razor editor in Visual Studio, cohosting boosts speed/reliability and much more.
Here's a list of notable improvements to the Razor editor:
Performance & Reliability (Cohosting)
The Razor compiler and tooling experience now runs cohosted inside Roslyn LSP server, greatly speeding up Razor file updates (e.g. Hot Reload changes apply much faster) and improving reliability during editing.
To enable co-hosting go to Tools → Options and search cohost, which should show the feature Use Roslyn Cohost server (requires restart). After enabling this, it's recommended to restart Visual Studio to ensure it's enabled.
Simplify Tag Code Action (Community Contribution)
Added a new code fix to convert an empty component tag into a self-closing tag when no content or required child elements are present (contributed by Peter Juhasz). For example
<Component Attribute="Value"> </Component>can be simplified to<Component Attribute="Value" />Extract Style Block to .razor.css
You can now use a code action to extract an inline
<style>section from a Razor component into a separate .razor.css file. This helps isolate component-specific styles Blazor's CSS Isolation by automatically creating or updating the matching .razor.css file for the component.@bind:event IntelliSense
Improved Razor IntelliSense to provide completion suggestions for
@bind:<event>values (contributed by Peter Juhasz). When using two-way data binding with custom events (for example,@bind="Value" @bind:event="oninput"in Blazor), the editor now autocompletes valid event names like oninput or onchange.Formatting Improvements
The new Razor formatting engine received numerous bug fixes and enhancements. Razor editor now better honors C# formatting style options (e.g. spacing, indenting rules from Visual Studio configuration) inside Razor files and resolves various formatting quirks that existed in previous versions (especially around mixed HTML/C# content).
Debugging Tooltip Enhancements
Improved the debugger hover tooltips in Razor files. Visual Studio now more reliably displays variable values and object previews when you hover over variables or components in a Razor file during a debugging session, making it easier to inspect data at runtime.
Go To Definition for Tag Helpers
Leveraging new capabilities from cohosting, you can now navigate to the definitions of ASP.NET Core MVC Tag Helpers and their attributes directly from Razor files. Hitting F12 (or Ctrl+Click) on a Tag Helper (e.g. an
<input asp-for=" ">or any MVC Tag Helper usage) will jump to its source definition. This long-requested feature makes it much easier to explore and understand Tag Helpers in your projects.General IntelliSense Fixes
Addressed several Razor editor IntelliSense issues. HTML snippets (like typing
div+Tabto expand a<div>block) now appear consistently in Razor files (previously they sometimes failed to show up). Autocomplete for hyphenated attributes and component parameters (e.g.data-*attributes or Blazor component parameters with dashes) is more robust, so suggestions and completions work as expected in these cases.Razor Compiler Optimizations
Introduced significant compiler performance and memory usage improvements for Razor and Blazor projects. Solutions with many Razor components should see faster builds and less memory overhead. These optimizations make editing and building Razor pages snappier, addressing prior feedback about high memory usage and slow incremental builds in large Blazor apps.
App modernization
GitHub Copilot app modernization now built into Visual Studio.
The GitHub Copilot app modernization agent is an AI-powered tool in Visual Studio that helps you upgrade .NET applications to newer versions and migrate them to Azure.
How to get started
- Open your .NET project or solution in Visual Studio.
- Launch the modernization agent using one of the following methods:
- Right-click the solution or project in Solution Explorer and select Modernize.
- or -- Open the Copilot Chat window and type
@modernizefollowed by your upgrade request.- Let the
@modernizeagent know what you'd like to upgrade or migrate.With the app modernization agent, it's easier than ever to keep your .NET apps up to date and take advantage of the latest Azure features. Give it a try and see how much time you can save!
C++
Toolset Windows support
The Microsoft C++ toolset now requires Windows 10 or Windows Server 2016 as the minimum supported operating systems.
The Microsoft C++ toolset has updated its minimum supported operating systems. Starting with this release, the toolset no longer supports targeting:
- Windows 7 / Windows Server 2008 R2
- Windows 8 / Windows Server 2012
- Windows 8.1 / Windows Server 2012 R2
To build applications with the latest C++ tools, your target platform must be Windows 10 or Windows Server 2016 (or later).
This change enables improved performance, security, and alignment with the latest Windows platform capabilities.
C++ feature deprecations and removals
Notices of removals for C++AMP, ARM32 toolchain, and /DEBUG:FASTLINK and deprecation of /await.
C++AMP, ARM32-targeting MSVC build tools, and the
/DEBUG:FASTLINKlinker option have been deprecated and removed. If you are using/DEBUG:FASTLINK, we recommend switching to/DEBUG:FULL. If you need to target ARM32, you can keep using the Visual Studio 2022 v143 build tools.The
/awaitswitch is deprecated and will be removed in a future release. Standard C++ coroutines are available by default in C++20 or later, or use/await:strictin earlier language modes.
C++ STL updates
Fresh standard library improvements-especially around
<regex>. See what's new.We've made a large set of updates and improvements to our C++ standard library implementation, especially in the area of
<regex>. See our STL Changelog for a complete list of changes.
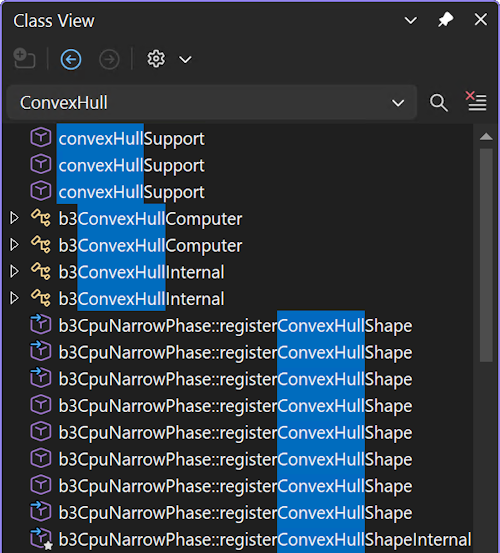
Class View improvement 📣
Substring search in the Class View.
The Class View window now supports substring searches.
📣 See feature ticket to share your feedback and continue the conversation.
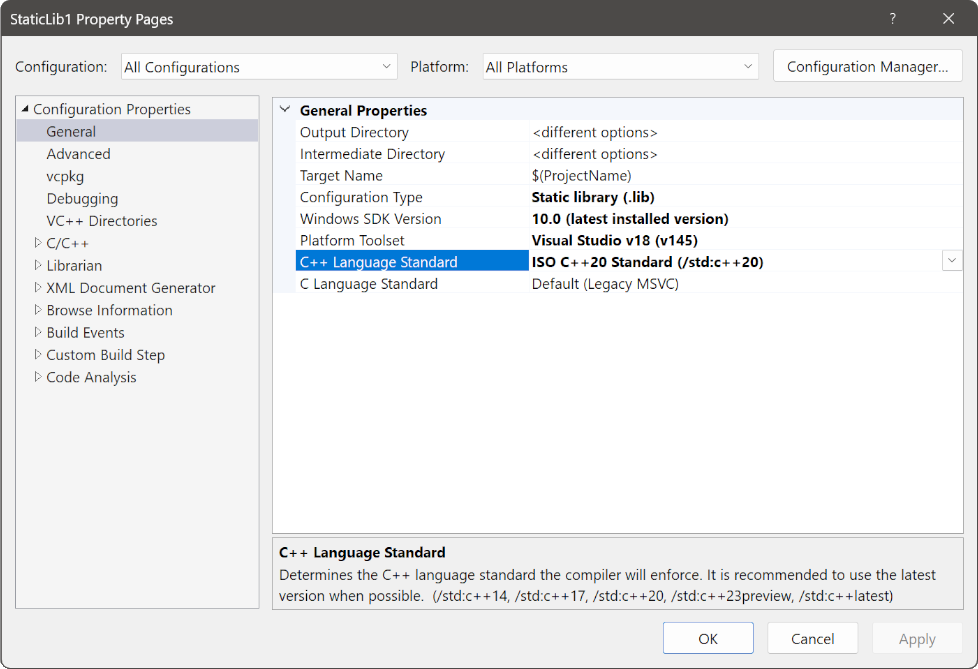
Project template updates
Use C++20 by default in new C++ projects.
Many of the C++ project templates have been updated to build with the C++20 standard by default. This includes the Console App, Windows Desktop Application, Dynamic-Link Library, and Static Library.
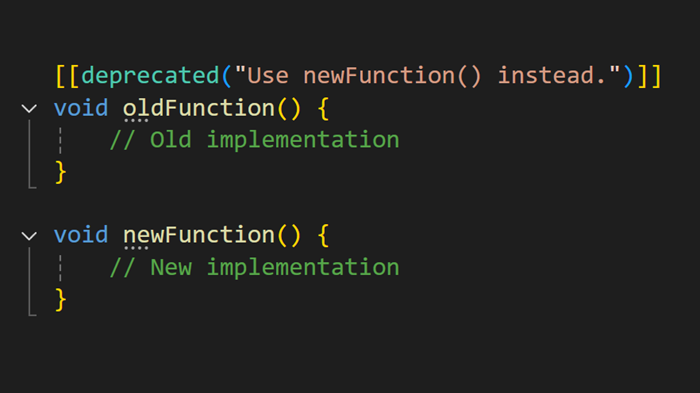
Syntax highlighting for C++ attributes 📣
C++ attributes now shine in your editor with beautiful syntax highlighting that makes your code more readable and visually appealing!
C++ attributes are now beautifully colored in the editor, making your code more visually distinctive and easier to read! By default, they use the same theme color as user-defined types, seamlessly integrating with your existing color scheme.
📣 See feature ticket to share your feedback and continue the conversation.
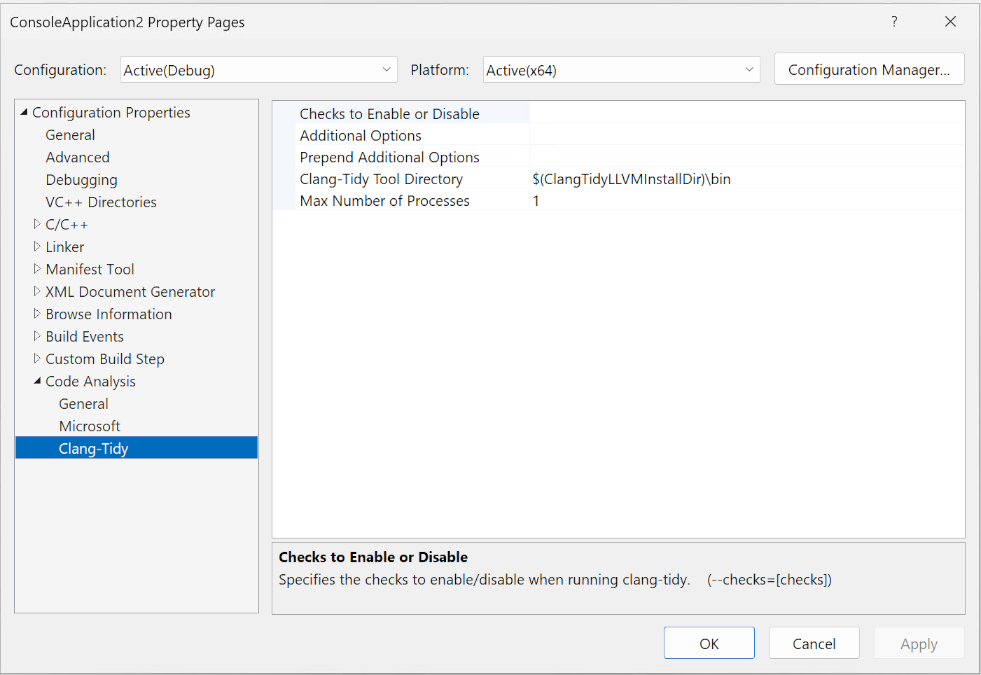
clang-tidy improvements 📣
Supercharge your C++ code analysis with enhanced clang-tidy configuration options for faster builds and custom workflows.
clang-tidycode analysis has some exciting new configuration options! You can now allocate more processors to run code analysis as part of your build, speeding up your development workflow. Plus, you can add custom arguments to the command line used to invokeclang-tidy, giving you complete control over your analysis setup.Access these powerful new options from Project Properties → Code Analysis → Clang-Tidy.
📣 See feature ticket to share your feedback and continue the conversation.
Version 11018.127
Released September 23rd, 2025
| Top bug fixes | From the community |
|---|---|
| Github Copilot: Trying to access a static method when the static class has not been properly initialized | Feedback ticket |
| "Open with..." not working. | Feedback ticket |
Version 11012.119
Released September 16th, 2025
| Top bug fixes | From the community |
|---|---|
| VS 2026 Insiders - Tab Layout only works with Top | Feedback ticket |
Version 11010.61
Released September 11th, 2025
| Top bug fixes | From the community |
|---|---|
| Errors seen immediately following new install | Feedback ticket |
Known Issues
For more information, see VS Developer Community Known Issues
From our entire team, thank you for choosing Visual Studio! For the latest updates, resources, and news, check out the Visual Studio Hub and stay in touch.
Happy coding!
The Visual Studio team
Note
This update may include new Microsoft or third-party software that is licensed separately, as set out in the 3rd Party Notices or in its accompanying license.