Note
Access to this page requires authorization. You can try signing in or changing directories.
Access to this page requires authorization. You can try changing directories.
WinDbg is the latest version of the debugger that offers more modern visuals, faster windows, and a full-fledged scripting experience. WinDbg is built with an extensible debugger data model.
Note
WinDbg was previously released as WinDbg Preview in the Microsoft Store. WinDbg uses the same underlying engine as WinDbg (Classic). It supports all the same commands, extensions, and workflows.

Use prominent features
Improve your debugging experience with the many features and programming benefits that are provided in WinDbg:
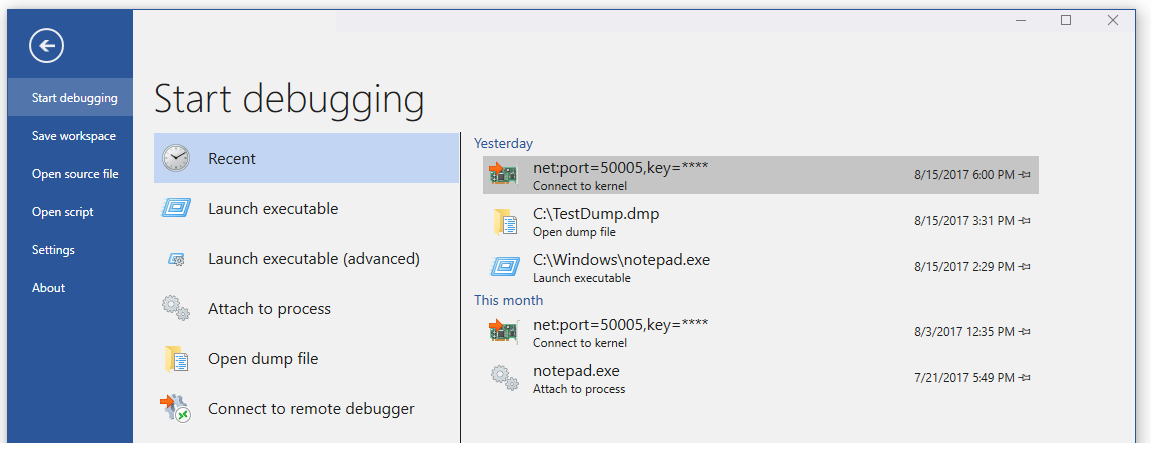
Connection setup and recall: Save recent targets and session configurations. You can quickly restart saved items from the File menu.
Dark theme: Enable user-interface preferences like the dark theme by selecting File > Settings.
Keyboard navigation: Use keyboard shortcuts like Ctrl+Tab, which lets you easily move between windows.

Dump file processor detection: Take advantage of autodetection for your processor architecture and quickly set up managed debugging.
Performance improvements: Work with tool windows that load asynchronously and cancel them as needed. When you run a command, WinDbg can stop the loading of your locals, watch, or other windows.
Start debugging
Get started debugging in WinDbg with the following features:
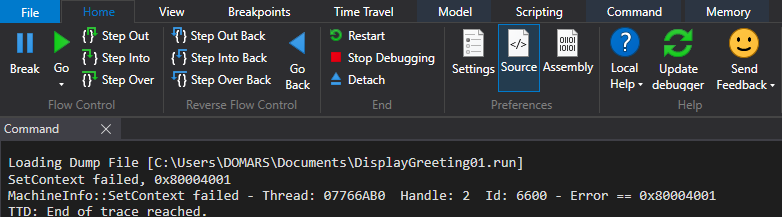
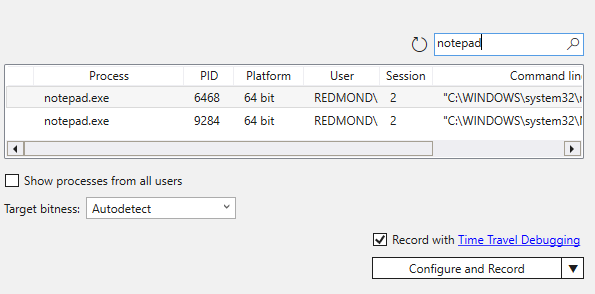
Integrated Time Travel Debugging (TTD): Select the Record with Time Travel Debugging option when you launch or attach to a process. WinDbg sets up TTD, starts recording, and opens the trace afterward.
For more information, see Time Travel Debugging: Overview.
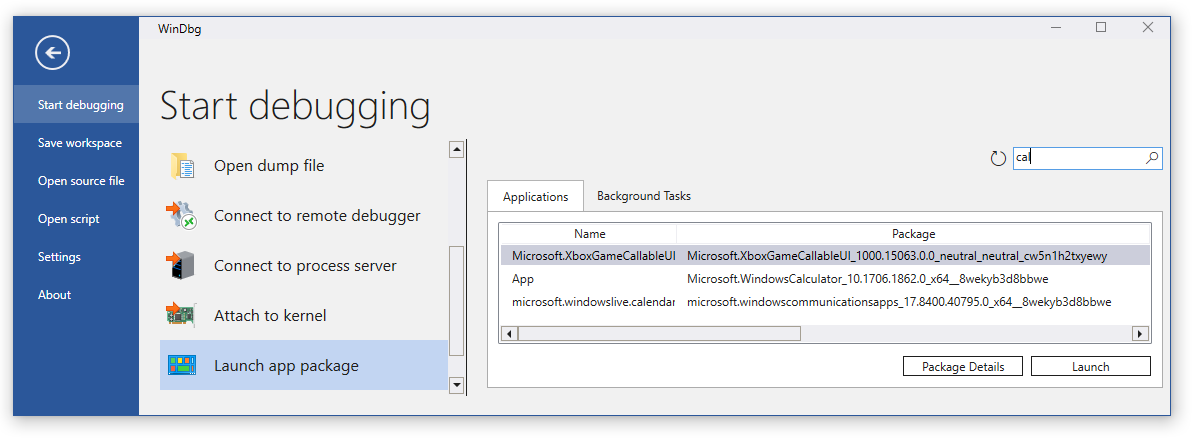
Launch app packages: Debug your universal app or background task with a single mouse click.
For more information, see Launch app package.
Attach to a process: Use the Attach view to get a detailed summary of running processes, access easier configuration, and search support.

Work with tool windows
Take advantage of the many improvements to the tool windows in WinDbg:
Command: Offers improved DML support, text highlighting, and search (including regex).

Source code: Provides syntax highlighting and other general improvements similar to most modern text editors.

Disassembly: Maintains the highlight on the current instruction as you scroll.

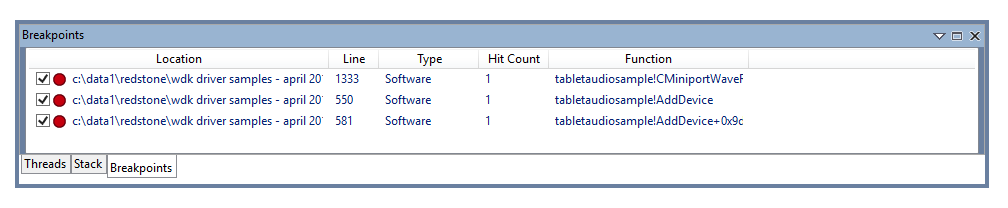
Breakpoints: Shows all of your current breakpoints, a one-click toggle, and a hit count. For more information, see WinDbg: Breakpoints.
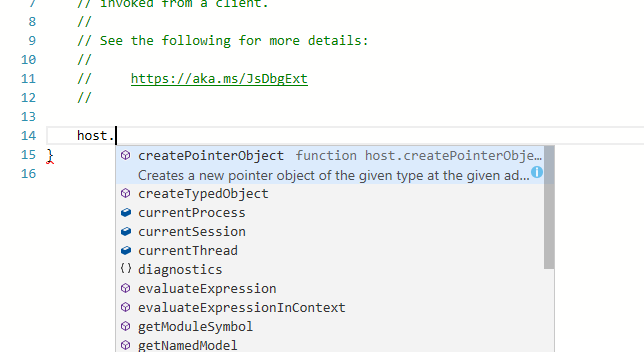
Scripting: Makes it easier for you to develop JavaScript and NatVis extensions, and use error highlighting and IntelliSense. For more information, see WinDbg: Scripting.
Data Model: Provides an expandable and browsable version of the
dxanddx -gcommands. This feature helps you create powerful tables on top of your NatVis, JavaScript, and LINQ queries. For more information, see WinDbg: Data model.
Locals and Watch: Based on the data model used by the
dxcommand. They both benefit from the same features as other data model windows.Memory: Has highlighting and improved scrolling.
Logs: Provides an under-the-covers log of the WinDbg internals. You can view the logs for troubleshooting or to monitor long-running commands.
Explore WinDbg in action
Watch the following episodes of the Defrag Tools show and see WinDbg in action:
- Defrag Tools #182: Tim, Chad, and Andy go over the basics of WinDbg and some of the features.
- Defrag Tools #183: Nick, Tim, and Chad use WinDbg and go through a quick demo.
- Defrag Tools #184: Bill and Andrew walk through the scripting features (JavaScript) in WinDbg.
- Defrag Tools #185: James and Ivette introduce TTD.
- Defrag Tools #186: James and JCAB cover advanced TTD.
Install and configure WinDbg
Review the following articles for information about installing and configuring WinDbg:
Provide feedback
Your feedback helps the Microsoft team guide WinDbg's development and prioritize features.
To report bugs or suggest features, select Feedback on the ribbon to go to the WinDbg-Feedback page on GitHub where you can file a new issue.