Container Insights のマルチテナント ログは、AKS を使用して共有クラスター プラットフォームを運用するお客様に役立ちます。 所有する K8s 名前空間で実行されているコンテナーのコンテナー ログにアクセスし、Azure Log Analytics ワークスペースに関連付けられている課金と管理にアクセスできるように、異なるチームによってログを分離する方法でコンテナー コンソール ログ収集を構成する機能が必要な場合があります。 たとえば、kube-system などのインフラストラクチャ名前空間のコンテナー ログは、インフラストラクチャ チームの特定の Log Analytics ワークスペースに送信できますが、各アプリケーション チームのコンテナー ログはそれぞれのワークスペースに送信できます。
この記事では、Container Insights でのマルチテナント ログの動作、サポートされているシナリオ、およびこの機能を使用するためにクラスターをオンボードする方法について説明します。
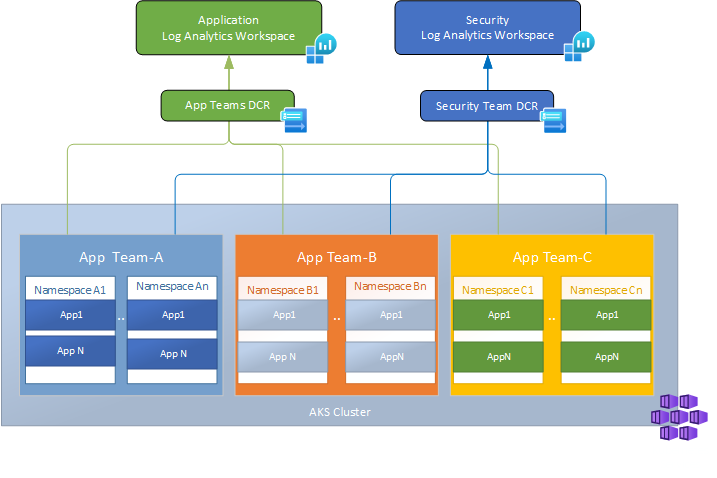
シナリオ
Container insights のマルチテナント ログ機能では、次のシナリオがサポートされています。
マルチテナンシー(複数のユーザーが1つのシステムを共有する形態) 1 つ以上の K8s 名前空間から対応する Log Analytics ワークスペースにコンテナー ログ (stdout および stderr) を送信します。

マルチホーム: 1 つ以上の K8s 名前空間から複数の Log Analytics ワークスペースに、同じコンテナー ログのセット (stdout および stderr) を送信します。


しくみ
Container Insights では、 データ収集規則 (DCR) を使用して、AKS クラスターのデータ収集設定を定義します。 Container Insights を有効にすると、既定の ContainerInsights 拡張機能 DCR が自動的に作成されます。 この DCR はシングルトンであり、Kubernetes クラスターごとに 1 つの DCR があることを意味します。
マルチテナント ログの場合、Container Insights は ContainerLogV2Extension DCR のサポートを追加します。これは、K8s 名前空間のコンテナー ログのコレクションを定義するために使用されます。 複数 の ContainerLogV2Extension DCR は、異なる名前空間に対して異なる設定を使用して作成でき、すべて同じ AKS クラスターに関連付けられます。
ConfigMap を使用してマルチテナント機能を有効にすると、Container Insights エージェントは、既定の ContainerInsights 拡張機能 DCR と、AKS クラスターに関連付けられている ContainerLogV2Extension DCR の両方を定期的にフェッチします。 このフェッチは、コンテナーの開始時に 5 分ごとに実行されます。 追加の ContainerLogV2Extension DCR が追加されると、それは次回フェッチが実行される際に認識されます。 コンテナー ログ以外の既定の DCR 内のすべての構成済みストリームは、引き続き既定の ContainerInsights DCR の Log Analytics ワークスペースに通常どおり送信されます。
次のロジックを使用して、各ログ エントリを処理する方法を決定します。
- ログ エントリの名前空間に ContainerLogV2Extension DCR がある場合は、その DCR を使用してエントリを処理します。 これには、Log Analytics ワークスペースの変換先と、インジェスト時の変換が含まれます。
- ログ エントリの名前空間に ContainerLogV2Extension DCR がない場合は、既定の ContainerInsights DCR を使用してエントリが処理されます。
制限事項
- Container Insights での大規模なログ収集に関する制限事項を参照してください。
- クラスターごとに最大 30 個の ContainerLogV2Extension DCR アソシエーションがサポートされています。
前提条件
- Container Insights (プレビュー) の高スケール ログ収集のガイダンスを使用して、クラスターの高ログ スケール モードを構成する必要があります。
- データ収集エンドポイント (DCE) は、アプリケーションまたはインフラストラクチャ チームごとに DCR を使用して作成されます。 Container Insights での大規模なログ収集のネットワーク ファイアウォール要件の説明に従って、各 DCE のログ インジェスト エンドポイントをファイアウォールで構成する必要があります。
クラスターのマルチテナントを有効にする
「ConfigMap の構成と展開」のガイダンスに従って、クラスターの ConfigMap をダウンロードして更新します。
enabledのagent_settings.high_log_scale設定を次のように変更して、高スケール モードを有効にします。agent-settings: |- [agent_settings.high_log_scale] enabled = true次のように、
enabledのlog_collection_settings.multi_tenancy設定を変更して、マルチテナントを有効にします。log-data-collection-settings: |- [log_collection_settings] [log_collection_settings.multi_tenancy] enabled = true次のコマンドを使用して、ConfigMap をクラスターに適用します。
kubectl config set-context <cluster-name>
kubectl apply -f <configmap_yaml_file.yaml>
アプリケーションまたはインフラストラクチャ チームごとに DCR を作成する
アプリケーションまたはインフラストラクチャ チームごとに個別の DCR を作成するには、次の手順を繰り返します。 それぞれに、一連の K8s 名前空間と Log Analytics ワークスペースの宛先が含まれます。
ヒント
マルチホームの場合は、Log Analytics ワークスペースごとに個別の DCR テンプレートとパラメーター ファイルをデプロイし、同じ K8s 名前空間のセットを含めます。 これにより、同じログを複数のワークスペースに送信できるようになります。 たとえば、app-team-1、app-team-2 のログを LAW1 と LAW2 の両方に送信する場合、
- DCR1 を作成し、app-team-1 名前空間と app-team-2 名前空間に LAW1 を含める
- DCR2 を作成し、app-team-1 名前空間と app-team-2 名前空間に LAW2 を含める
次の ARM テンプレートとパラメーター ファイルを取得します。
テンプレート: https://aka.ms/aks-enable-monitoring-multitenancy-onboarding-template-file
[パラメーター]: https://aka.ms/aks-enable-monitoring-multitenancy-onboarding-template-parameter-file次の値の値を使用してパラメーター ファイルを編集します。
パラメーター名 説明 aksResourceIdAKS クラスターの Azure リソース ID aksResourceLocationAKS クラスターの Azure リージョン workspaceResourceIdLog Analytics ワークスペースの Azure リソース ID workspaceRegionLog Analytics ワークスペースの Azure リージョン K8sNamespacesこのパラメーター ファイルで定義されている Log Analytics ワークスペースに送信されるログの K8s 名前空間の一覧。 resourceTagValuesAKS、データ収集規則 (DCR)、およびデータ収集エンドポイント (DCE) で使用する Azure リソース タグ。 transformKqlインジェスト時間変換を使用した事前フィルター処理用の KQL フィルター。 たとえば、特定のポッドのログを除外するには、 source \| where PodName != '<podName>'を使用します。 詳細については、 Azure Monitor での変換に 関するページを参照してください。useAzureMonitorPrivateLinkScopeAzure Monitor Private Link スコープを構成するかどうかを示します。 azureMonitorPrivateLinkScopeResourceIdAzure Monitor Private Link スコープの Azure リソース ID。 次のコマンドを使用して、パラメーター ファイルを使用してテンプレートをデプロイします。
az deployment group create --name AzureMonitorDeployment --resource-group <aksClusterResourceGroup> --template-file existingClusterOnboarding.json --parameters existingClusterParam.json
マルチテナント ログの無効化
注
クラスターの Container Insights を完全に無効にする場合は、「 Kubernetes クラスターの監視を無効にする 」を参照してください。
クラスターでマルチテナント ログを無効にするには、次の手順を使用します。
次のコマンドを使用して、クラスターのすべての DCR 関連付けを一覧表示します。
az monitor data-collection rule association list-by-resource --resource /subscriptions/<subId>/resourcegroups/<rgName>/providers/Microsoft.ContainerService/managedClusters/<clusterName>次のコマンドを使用して、ContainerLogV2 拡張機能のすべての DCR 関連付けを削除します。
az monitor data-collection rule association delete --association-name <ContainerLogV2ExtensionDCRA> --resource /subscriptions/<subId>/resourcegroups/<rgName>/providers/Microsoft.ContainerService/managedClusters/<clusterName>ContainerLogV2Extension DCR を削除します。
az monitor data-collection rule delete --name <ContainerLogV2Extension DCR> --resource-group <rgName>container-azm-ms-agentconfigを編集し、enabledの下の[log_collection_settings.multi_tenancy]の値をtrueからfalseに変更します。kubectl edit cm container-azm-ms-agentconfig -n kube-system -o yaml
トラブルシューティング
Container insights でのマルチテナント ログに関する問題をトラブルシューティングするには、次の手順を実行します。
クラスターに対して 高スケールのログが 有効になっていることを確認します。
  # get the list of ama-logs and these pods should be in Running state
  # If these are not in Running state, then this needs to be investigated
  kubectl get po -n kube-system | grep ama-logs
  # get the logs one of the ama-logs daemonset pod and check for log message indicating high scale enabled
  kubectl logs ama-logs-xxxxx -n kube-system -c ama-logs | grep high
  # output should be something like
   "Using config map value: enabled = true for high log scale config"
クラスターで ContainerLogV2 スキーマ が有効になっていることを確認します。
  # get the list of ama-logs and these pods should be in Running state
  # If these are not in Running state, then this needs to be investigated
  kubectl get po -n kube-system | grep ama-logs
  # exec into any one of the ama-logs daemonset pod and check for the environment variables
  kubectl exec -it  ama-logs-xxxxx -n kube-system -c ama-logs -- bash
  # check if the containerlog v2 schema enabled or not
  env | grep AZMON_CONTAINER_LOG_SCHEMA_VERSION
  # output should be v2. If not v2, then check whether this is being enabled through DCR
  AZMON_CONTAINER_LOG_SCHEMA_VERSION=v2
  # check if its enabled through DCR
  grep -r "enableContainerLogV2" /etc/mdsd.d/config-cache/configchunks/
  # validate the enableContainerLogV2 configured with true or not from JSON output
クラスターに対してマルチテナントが有効になっていることを確認します。
  # get the list of ama-logs and these pods should be in Running state
  # If these are not in Running state, then this needs to be investigated
  kubectl get po -n kube-system | grep ama-logs
  # get the logs one of the ama-logs daemonset pod and check for log message indicating high scale enabled
  kubectl logs ama-logs-xxxxx -n kube-system -c ama-logs | grep multi_tenancy
  # output should be something like
  "config::INFO: Using config map setting multi_tenancy enabled: true, advanced_mode_enabled: false and namespaces: [] for Multitenancy log collection"
ContainerInsightsExtension と ContainerLogV2Extension に関連する DCR と DCEs が作成されていることを確認します。
    az account set -s <clustersubscriptionId>
    az monitor data-collection rule association list-by-resource --resource "<clusterResourceId>"
    # output should list both ContainerInsightsExtension and ContainerLogV2Extension DCRs associated to the cluster
    # From the output, for each dataCollectionRuleId and check dataCollectionEndpoint associated or not
    az monitor data-collection rule show --ids <dataCollectionRuleId>
    # you can also check the extension settings for the K8s namespace configuration
エージェントが関連付けられているすべての DCR をダウンロードしていることを確認します。
  # get the list of ama-logs and these pods should be in Running state
  # If these are not in Running state, then this needs to be investigated
  kubectl get po -n kube-system | grep ama-logs
  # exec into any one of the ama-logs daemonset pod and check for the environment variables
  kubectl exec -it  ama-logs-xxxxx -n kube-system -c ama-logs -- bash
  # check if its enabled through DCR
  grep -r "ContainerLogV2Extension" /etc/mdsd.d/config-cache/configchunks
  # output should list all the associated DCRs and configuration
  # if there are no DCRs downloaded then likely Agent has issues to pull associate DCRs and this could be missing network or firewall issue and check for errors in mdsd.err log file
  cat /var/opt/microsoft/linuxmonagent/log/mdsd.err
fluent-bit-out-oms-runtime.logファイルにエラーがあるかどうかを確認する
  # get the list of ama-logs and these pods should be in Running state
  # If these are not in Running state, then this needs to be investigated
  kubectl get po -n kube-system | grep ama-logs
  # exec into any one of the ama-logs daemonset pod and check for the environment variables
  kubectl exec -it ama-logs-xxxxx -n kube-system -c ama-logs -- bash
  # check for errors
  cat /var/opt/microsoft/docker-cimprov/log/fluent-bit-out-oms-runtime.log
次のステップ
- コンテナーの分析情報の詳細を参照してください。