Applies to: ✅Microsoft Fabric✅Azure Data Explorer✅Azure Monitor✅Microsoft Sentinel
時間グラフのビジュアルは折れ線グラフの一種です。 クエリの最初の列は x 軸であり、datetime である必要があります。 その他の数値列は y 軸です。 1 つの文字列の列の値を使用して数値列をグループ化し、グラフ内にさまざまな線を作成します。 他の文字列の列は無視されます。 The time chart visual is like a line chart except the x-axis is always time.
Note
This visualization can only be used in the context of the render operator.
Syntax
T|rendertimechart [with(propertyName=propertyValue [, ...])]
Learn more about syntax conventions.
Parameters
| Name | タイプ | Required | Description |
|---|---|---|---|
| T | string |
✔️ | 入力テーブル名。 |
| propertyName, propertyValue | string |
キーと値のプロパティのペアのコンマ区切りのリスト。 See supported properties. |
Supported properties
すべてのプロパティは省略可能です。
| PropertyName | PropertyValue |
|---|---|
accumulate |
各メジャーの値がすべての先行タスク (true または false) に追加されるかどうか。 |
legend |
凡例を表示するかどうか (visible または hidden)。 |
series |
レコードごとに結合された値によってそのレコードが属する系列が定義される、コンマ区切りの列のリスト。 |
ymin |
Y 軸に表示される最小値。 |
ymax |
Y 軸に表示される最大値。 |
title |
視覚化のタイトル (string 型)。 |
xaxis |
x 軸のスケールを設定する方法 (linear または log)。 |
xcolumn |
x 軸に使用される結果の列。 |
xtitle |
x 軸のタイトル (string 型)。 |
yaxis |
y 軸のスケールを設定する方法 (linear または log)。 |
ycolumns |
x 列の値ごとに提供された値で構成される列のコンマ区切りのリスト。 |
ysplit |
視覚化を複数の y 軸の値に分割する方法。 詳細については、「 ysplit プロパティ」を参照してください。 |
ytitle |
y 軸のタイトル (string 型)。 |
ysplit プロパティ
この視覚化では、複数の y 軸値への分割がサポートされています。
ysplit |
Description |
|---|---|
none |
1 つの y 軸がすべての系列データに表示されます。 (Default) |
axes |
1 つのグラフに、複数の y 軸 (系列ごとに 1 つ) が表示されます。 |
panels |
ycolumn 値ごとに 1 つのグラフがレンダリングされます。 最大 5 つのパネル。 |
Examples
このセクションの例では、構文を使用して作業を開始する方法を示します。
The examples in this article use publicly available tables in the help cluster, such as the
StormEventstable in the Samples database.
The examples in this article use publicly available tables, such as the
Weathertable in the Weather analytics sample gallery. ワークスペース内のテーブルと一致するように、クエリ例のテーブル名を変更する必要がある場合があります。
タイムグラフをレンダリングする
次の例では、"Web アプリ" というタイトルでタイムチャートをレンダリングします。 データをベースライン、季節性、傾向、および残余成分に分解する"1 か月間のトラフィック。
let min_t = datetime(2017-01-05);
let max_t = datetime(2017-02-03 22:00);
let dt = 2h;
demo_make_series2
| make-series num=avg(num) on TimeStamp from min_t to max_t step dt by sid
| where sid == 'TS1'   //  select a single time series for a cleaner visualization
| extend (baseline, seasonal, trend, residual) = series_decompose(num, -1, 'linefit')  //  decomposition of a set of time series to seasonal, trend, residual, and baseline (seasonal+trend)
| render timechart with(title='Web app. traffic over a month, decomposition')
タイムグラフにラベルを付ける
次の例では、週ごとにグループ化された作物の被害を示すタイムチャートをレンダリングします。 タイムグラフ x 軸ラベルは "Date" で、y 軸ラベルは "トリミングの損傷" です。
StormEvents
| where StartTime between (datetime(2007-01-01) .. datetime(2007-12-31))
    and DamageCrops > 0
| summarize EventCount = count() by bin(StartTime, 7d)
| render timechart
    with (
    title="Crop damage over time",
    xtitle="Date",
    ytitle="Crop damage",
    legend=hidden
    )
複数の y 軸を表示する
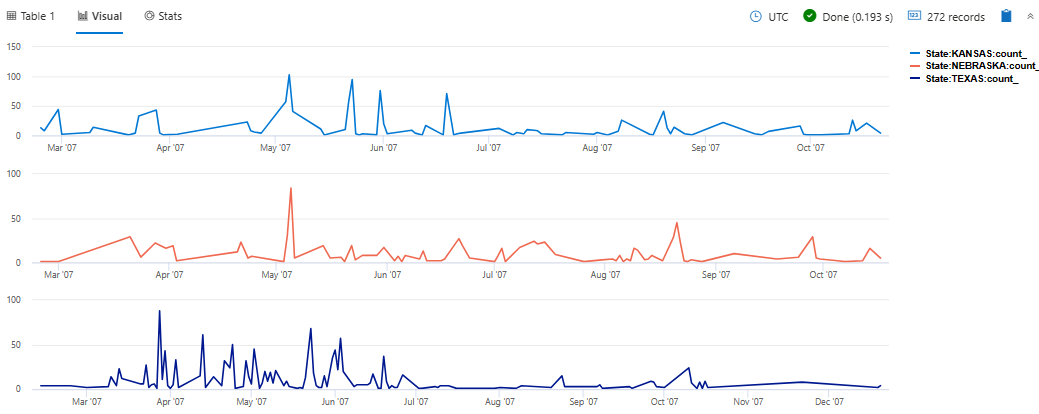
次の例では、テキサス州、ネブラスカ州、およびカンサス州の毎日の雹イベントをレンダリングします。 視覚化では、ysplit プロパティを使用して、比較のために各状態のイベントを個別のパネルにレンダリングします。
StormEvents
| where State in ("TEXAS", "NEBRASKA", "KANSAS") and EventType == "Hail"
| summarize count() by State, bin(StartTime, 1d)
| render timechart with (ysplit=panels)
Related content
Supported properties
すべてのプロパティは省略可能です。
| PropertyName | PropertyValue |
|---|---|
series |
レコードごとに結合された値によってそのレコードが属する系列が定義される、コンマ区切りの列のリスト。 |
title |
視覚化のタイトル (string 型)。 |
Example
次の例では、"Web アプリ" というタイトルでタイムチャートをレンダリングします。 データをベースライン、季節性、傾向、および残余成分に分解する"1 か月間のトラフィック。
let min_t = datetime(2017-01-05);
let max_t = datetime(2017-02-03 22:00);
let dt = 2h;
demo_make_series2
| make-series num=avg(num) on TimeStamp from min_t to max_t step dt by sid
| where sid == 'TS1'   //  select a single time series for a cleaner visualization
| extend (baseline, seasonal, trend, residual) = series_decompose(num, -1, 'linefit')  //  decomposition of a set of time series to seasonal, trend, residual, and baseline (seasonal+trend)
| render timechart with(title='Web app. traffic of a month, decomposition')


