Applies to: ✅Microsoft Fabric✅Azure Data Explorer
카드 시각적 개체는 하나의 요소만 표시합니다. 출력에 열과 행이 여러 개인 경우 첫 번째 결과 레코드는 스칼라 값 집합으로 처리되고 카드로 표시됩니다.
Note
This visualization can only be used in the context of the render operator.
Syntax
T|rendercard [with(propertyName=propertyValue [, ...])]
Learn more about syntax conventions.
Parameters
| Name | Type | Required | Description |
|---|---|---|---|
| T | string |
✔️ | 입력 테이블 이름입니다. |
| propertyName, propertyValue | string |
키-값 속성 쌍의 쉼표로 구분된 목록입니다. See supported properties. |
Supported properties
모든 속성은 선택 사항입니다.
| PropertyName | PropertyValue |
|---|---|
title |
시각화의 제목(형식 string)입니다. |
Example
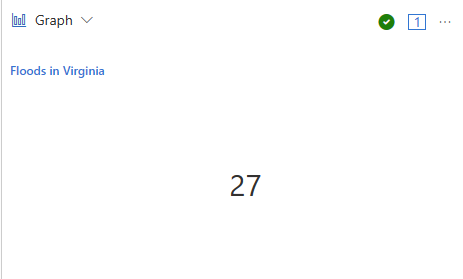
이 쿼리는 버지니아의 홍수 이벤트 수를 제공하고 결과를 카드 형식으로 표시합니다.
The examples in this article use publicly available tables in the help cluster, such as the
StormEventstable in the Samples database.
The examples in this article use publicly available tables, such as the
Weathertable in the Weather analytics sample gallery. 작업 영역의 테이블과 일치하도록 예제 쿼리에서 테이블 이름을 수정해야 할 수 있습니다.
StormEvents
| where State=="VIRGINIA" and EventType=="Flood"
| count
| render card with (title="Floods in Virginia")
