The most common way to analyze and present Prometheus data is with a Grafana dashboard. You can collect Prometheus metrics in Azure in the following ways:
This article explains how to configure Azure-hosted Prometheus metrics as a data source for Azure Managed Grafana, self-hosted Grafana running on an Azure VM, or a Grafana instance running outside Azure.
Azure Monitor workspace query endpoint
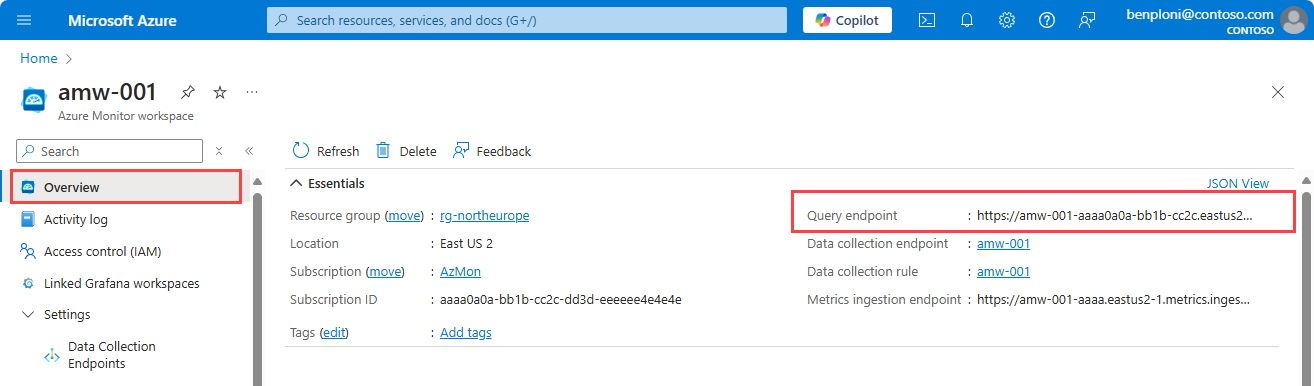
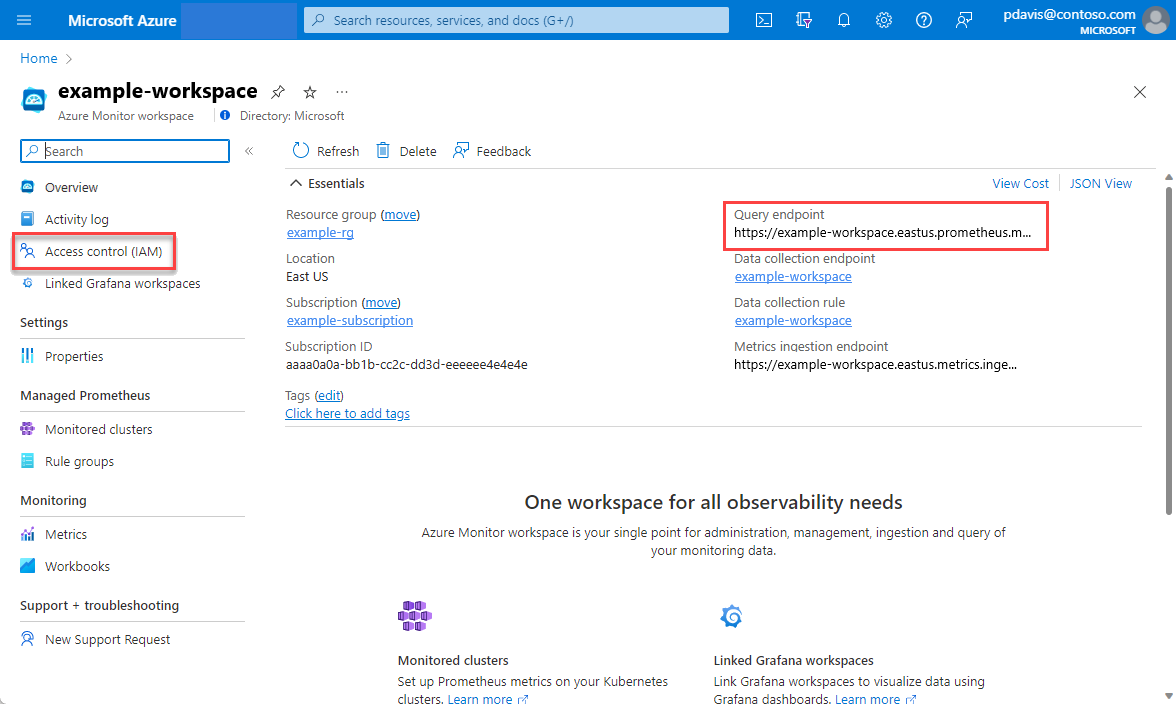
In Azure, Prometheus data is stored in an Azure Monitor workspace. When you configure the Prometheus data source in Grafana, you use the query endpoint for your Azure Monitor workspace. To find the query endpoint, open the Overview page for your Azure Monitor workspace in the Azure portal.
Azure Managed Grafana
An Azure Managed Grafana instance is automatically configured with a managed identity. The identity has the Monitoring Data Reader role assigned to it at the subscription level. This role allows the identity to read any monitoring data for the subscription. This identity is used to authenticate Grafana to Azure Monitor. You don't need to do anything to configure the identity.
Create the Prometheus data source in Grafana
To configure Prometheus as a data source, follow these steps:
Open your Azure Managed Grafana workspace in the Azure portal.
Select the endpoint to view the Grafana workspace.
Select Connections > Data sources.
Select Add data source.
Search for and select Prometheus.
Paste the query endpoint from your Azure Monitor workspace into the Prometheus server URL field.
Under Authentication, select Azure Auth.
Under Azure Authentication, select Managed Identity from the Authentication dropdown list.
Scroll to the bottom of the page and select Save & test.

Self-managed Grafana
The following section describes how to configure self-managed Grafana on an Azure VM to use Azure-hosted Prometheus data.
To allow access all Azure Monitor workspaces in a resource group or subscription, follow these steps:
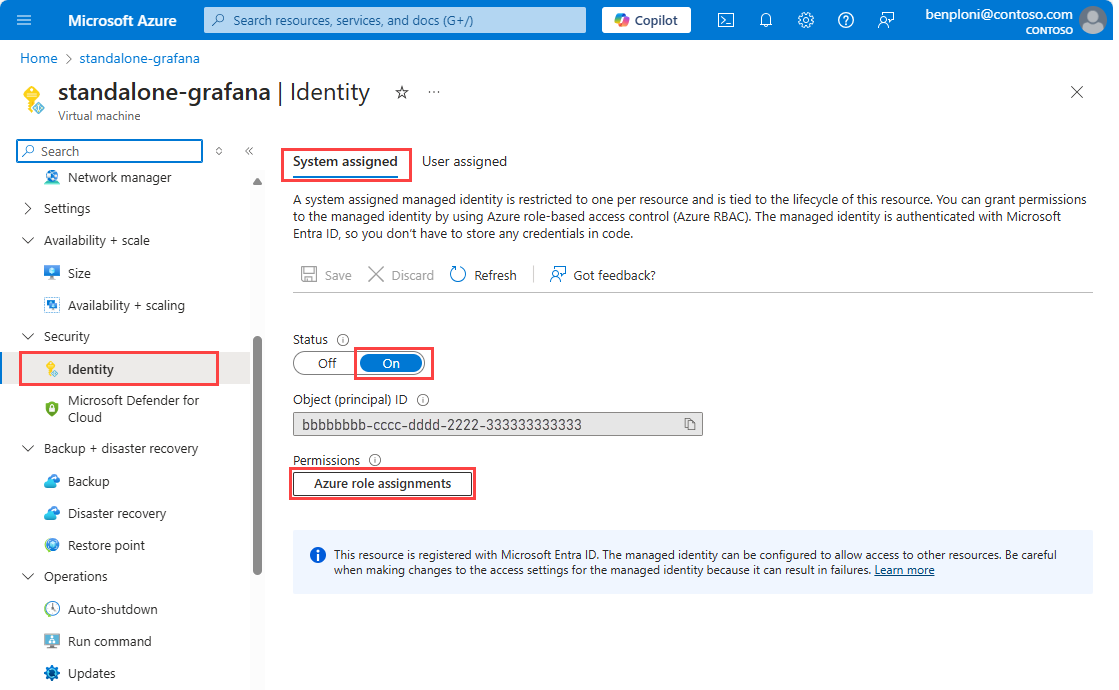
Open the Identity page for your VM in the Azure portal.
Set the Status to On.
Select Save.
Select Azure role assignments to review the existing access in your subscription.
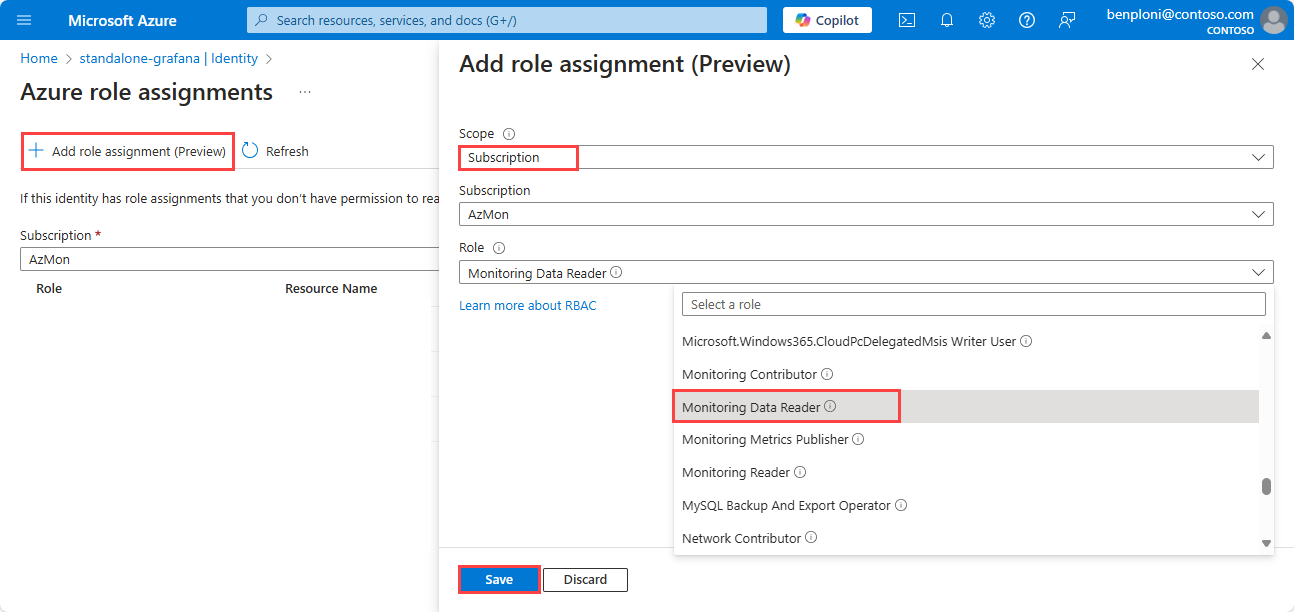
If the Monitoring Data Reader role isn't listed for your subscription or resource group, select + Add role assignment.
In the Scope dropdown list, select either Subscription or Resource group. Selecting Subscription allows access to all Azure Monitor workspaces in the subscription. Selecting Resource group allows access only to Azure Monitor workspaces in the selected resource group.
Select the specific subscription or resource group where your Azure Monitor workspace is located.
From the Role dropdown list, select Monitoring Data Reader.
Select Save.
Versions 9.x and greater of Grafana support Azure Authentication, but it isn't enabled by default. To enable Azure Authentication, update your Grafana configuration and restart the Grafana instance. To find your grafana.ini file, review the Configure Grafana document from Grafana Labs.
To enable Azure Authentication, follow these steps:
- Locate and open the
grafana.ini file on your VM.
- Under the
[auth] section of the configuration file, change the azure_auth_enabled setting to true.
- Under the
[azure] section of the configuration file, change the managed_identity_enabled setting to true
- Restart the Grafana instance.
Create the Prometheus data source in Grafana
To configure Prometheus as a data source, follow these steps:
Open Grafana in your browser.
Select Connections > Data sources.
Select Add data source.
Search for and select Prometheus.
Paste the query endpoint from your Azure Monitor workspace into the Prometheus server URL field.
Under Authentication, select Azure Auth.
Under Azure Authentication, select Managed Identity from the Authentication dropdown list.
Scroll to the bottom of the page and select Save & test.
Grafana hosted outside Azure
If your Grafana instance isn't hosted in Azure, you can use Microsoft Entra ID to connect to your Prometheus data in your Azure Monitor workspace.
To set up Microsoft Entra ID authentication, follow these steps:
- Register an app with Microsoft Entra ID.
- Grant access for the app to your Azure Monitor workspace.
- Configure your self-hosted Grafana with the app's credentials.
Register an app with Microsoft Entra ID
To register an app, open the Active Directory Overview page in the Azure portal.
Select App registration.
On the Register an application page, enter a name for the application.
Select Register.
Note the Application (client) ID value and Directory (tenant) ID value. They're used in the Grafana authentication settings.
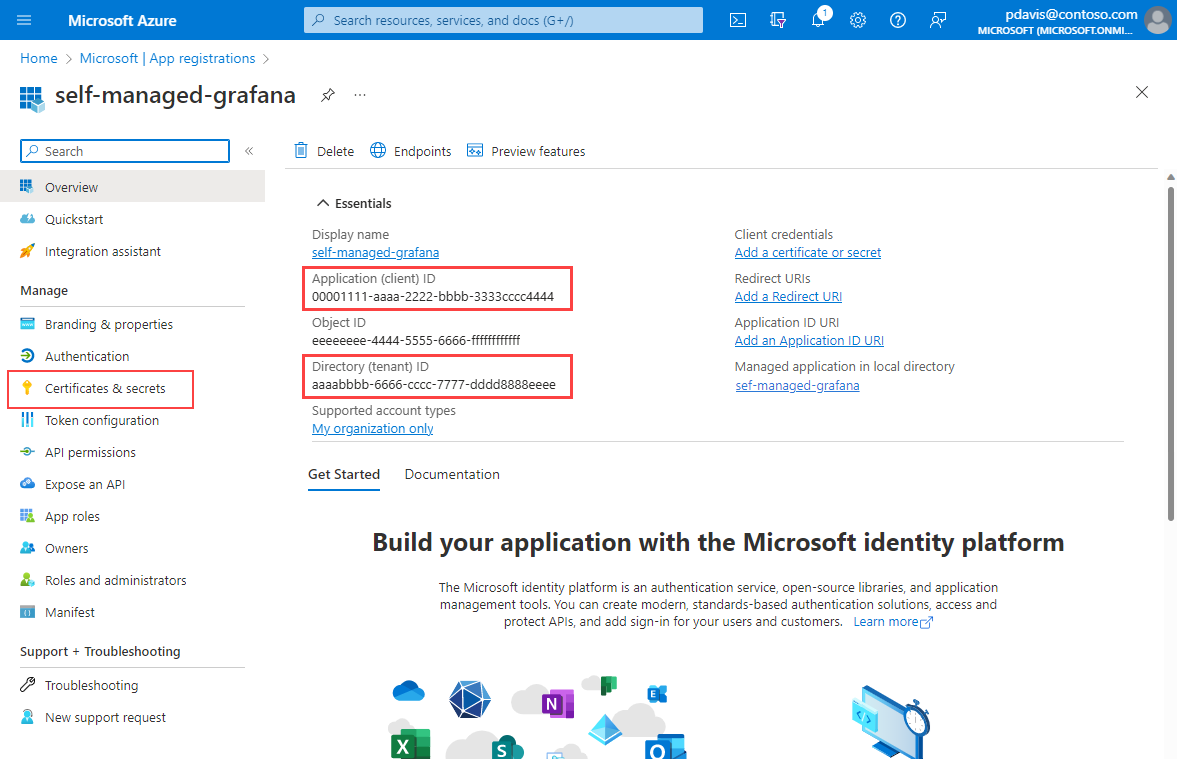
On the app's overview page, select Certificates and Secrets.
On the Client secrets tab, select New client secret.
Enter a description.
Select an expiration period from the dropdown list, and then select Add.
Note
Create a process to renew the secret and update your Grafana data source settings before the secret expires. After the secret expires, Grafana loses the ability to query data from your Azure Monitor workspace.

Copy and save the client secret value.
Note
You can view client secret values only immediately after creation. Save the secret before you leave the page.

Allow your app access to your workspace
Allow your app to query data from your Azure Monitor workspace.
Open your Azure Monitor workspace in the Azure portal.
On the overview page, note your Query endpoint value. The query endpoint is used when you set up your Grafana data source.
Select Access control (IAM).
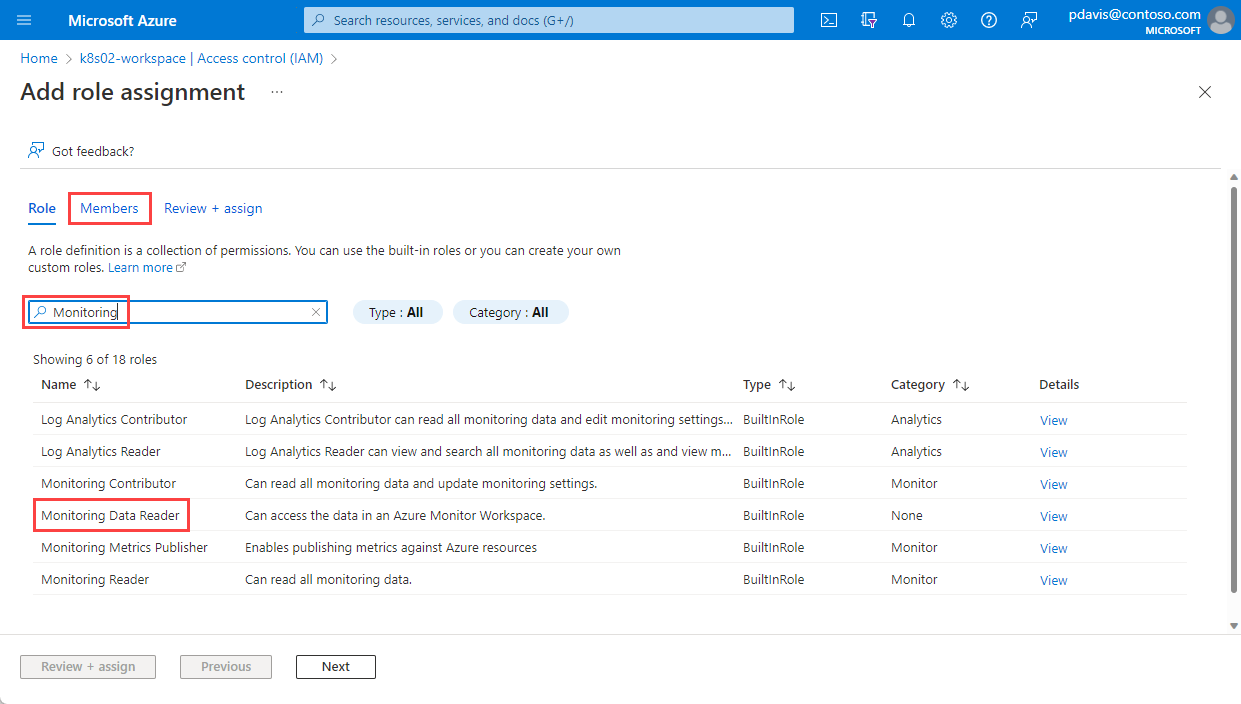
On the Access Control (IAM) page, select Add > Add role assignment.
On the Add role assignment page, search for Monitoring.
Select Monitoring data reader, and then select the Members tab.
Choose Select members.
Search for the app that you registered in the Register an app with Microsoft Entra ID section and select it.
Choose Select.
Select Review + assign.

You created your app registration and assigned it access to query data from your Azure Monitor workspace. The next step is to set up your Prometheus data source in Grafana.
Grafana now supports connecting to Azure Monitor managed Prometheus by using the Prometheus data source. For self-hosted Grafana instances, a configuration change is needed to use the Azure Authentication option in Grafana. For Grafana instances that Azure doesn't manage, make the following changes.
Versions 9.x and greater of Grafana support Azure Authentication, but it isn't enabled by default. To enable Azure Authentication, update your Grafana configuration and restart the Grafana instance. To find your grafana.ini file, review the Configure Grafana document from Grafana Labs.
- Locate and open the
grafana.ini file on your VM.
- Identify your Grafana version.
- For Grafana 9.0, in the
[feature_toggles] section, set prometheus_azure_auth to true.
- For Grafana 9.1 and later versions, in the
[auth] section, set the azure_auth_enabled setting to true.
- Restart the Grafana instance.
Create the Prometheus data source in Grafana
To configure Prometheus as a data source, follow these steps:
Open Grafana in your browser.
Select Connections > Data sources.
Select Add data source.
Search for and select Prometheus.
Paste the query endpoint from your Azure Monitor workspace into the URL field.
Under Authentication, select Azure Auth. For earlier Grafana versions, under Auth, turn on Azure Authentication.
Under Azure Authentication, select App Registration from the Authentication dropdown list.
Enter the Direct (tenant) ID value, the Application (client) ID value, and the Client Secret value that were generated when you created your app registration.
Scroll to the bottom of the page and select Save & test.

Frequently asked questions
This section provides answers to common questions.
I'm missing all or some of my metrics. How can I troubleshoot?
Use the Troubleshooting guide to learn how to ingest Prometheus metrics from the managed agent.
Why am I missing metrics that have two labels with the same name but different casing?
Azure Managed Prometheus is a case-insensitive system. It treats strings, such as metric names, label names, or label values, as the same time series if they differ from another time series only by the case of the string. For more information, see Prometheus metrics overview.
I see some gaps in metric data. Why is this behavior occurring?
During node updates, you might see a one-minute to two-minute gap in metric data for metrics collected from our cluster-level collectors. This gap occurs because the node that the data runs on is being updated as part of a normal update process. This update process affects cluster-wide targets such as kube-state-metrics and custom application targets that are specified. This process occurs when your cluster is updated manually or via automatic update.
This behavior is expected and doesn't affect any of our recommended alert rules.
Related content


