Note
Access to this page requires authorization. You can try signing in or changing directories.
Access to this page requires authorization. You can try changing directories.
Azure DevOps Services | Azure DevOps Server 2022 | Azure DevOps Server 2020
In this quickstart, you connect to an Analytics view to create Power BI reports for your Azure DevOps project. An Analytics view provides a basic way to specify the filter criteria for a Power BI report that's based on Analytics data.
You can create status and trend reports of your work-tracking data by using one of the default Analytics views available to you. As needed, you can also create a custom Analytics view.
This quickstart shows you how to create two reports in Power BI Desktop that are based on a default Analytics view:
- A daily trend chart for backlog items
- A card that displays the count of active user stories
Important
Analytics views only support Azure Boards data (work items). Analytics views don't support other data types, such as pipelines. Views provide a flat list of work items and don't support work item hierarchies. At this point, there are no plans to update the connector to support other types of data. For information on other approaches, see About Power BI integration.
Prerequisites
| Category | Requirements |
|---|---|
| Access levels | - Project member. - At least Basic access. |
| Permissions | The View Analytics permission set to Allow. For more information, see Set permissions to access Analytics and Analytics views. |
| Tools | - Azure Boards turned on. - Power BI Desktop. |
| Tasks | Monitor work items over a specified period to generate a trend report. |
| Category | Requirements |
|---|---|
| Access levels | - Project member. - At least Basic access. |
| Permissions | The View Analytics permission set to Allow. For more information, see Set permissions to access Analytics and Analytics views. |
| Tools | - The Analytics extension. Members of the Project Collection Administrators group can add and enable the service. - Azure Boards turned on. - Power BI Desktop. |
| Tasks | Monitor work items over a specified period to generate a trend report. |
Open Analytics to access views
From your web portal, select Boards > Analytics views.
If you don't see Analytics views, check that you have permissions for viewing Analytics. See Permissions and prerequisites to access Analytics.

Verify the default Analytics view for your data
If you verify the view you want to use in Power BI, your view is more likely to load correctly in Power BI.
To verify your view, take the following steps. If verification takes too long, you can quickly adjust the view. For instance, you can add filters or narrow your history and then verify your view again.
On the Analytics views page, go to the All tab.
On the default view, select the
 More Actions icon, and then select Edit. For a project that uses the Agile process, use the Stories - Last 30 days view.
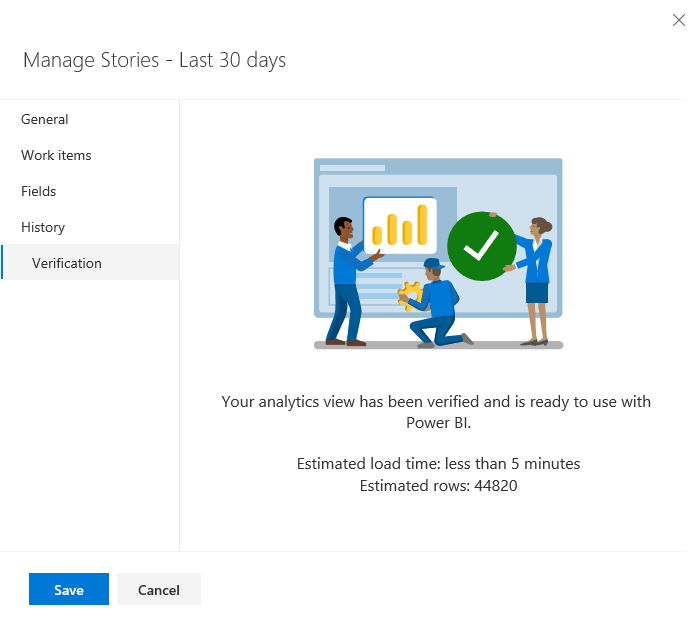
Go to the Verification tab, and then select Verify view.

Wait until the verification process finishes. The verification time depends on the amount of data that you define in your view. For example, one view might include all work item types and all history. It would take more time to verify than a view that includes only stories and specifies a rolling period of 30 days.
If your view is successfully verified, go to the next step. If it's unsuccessful, go to the Work Items tab and adjust the settings by selecting fewer teams or specifying fewer work items in the dataset.
For more information about defining views, see Create an Analytics view.

Connect to an Analytics view
Follow these steps to connect to an Analytics view:
Open Power BI Desktop.
Sign in to the service. First-time access requires you to sign in and authenticate your credentials. Power BI Desktop saves your credentials, so you only have to sign in once.
Note
Azure DevOps doesn't support cross-tenant scenarios that use Open Authorization (OAuth). Instead, use service principals and managed identities.
Select Connect.

Select Get Data > Online Services, and then select Azure DevOps (Boards only) for cloud services or Azure DevOps Server (Boards only) for an on-premises server. Select Connect. Analytics views support queries only against work items and test cases.

Specify the basic parameters to connect to your data.
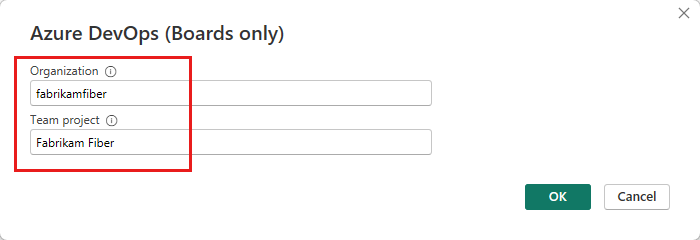

- Collection URL: Enter the URL where your Azure DevOps Server instance is hosted. An example URL is
https://fabrikam-server/AzureDevOpsServer/fabrikam-collection. - Team project: Enter only the project name. For example, enter Fabrikam-Fiber if the URL of your Azure DevOps Server instance is
https://fabrikam-server/AzureDevOpsServer/fabrikam-collection/Fabrikam-Fiber.
Important
Don't confuse the team name with the project name, which is a common mistake. For example, if the URL you use is
https://fabrikam-server/AzureDevOpsServer/fabrikam-collection/Fabrikam-Fiber-Git/Device, Fabrikam-Fiber-Git is the project name, and Device is the team name.After you successfully sign in, Power BI verifies that your credentials have the permissions that are needed to access the specified project. If any errors arise, see the FAQs for solutions to common problems.
- Collection URL: Enter the URL where your Azure DevOps Server instance is hosted. An example URL is
Select the Analytics view
Follow these steps to select the Analytics view:
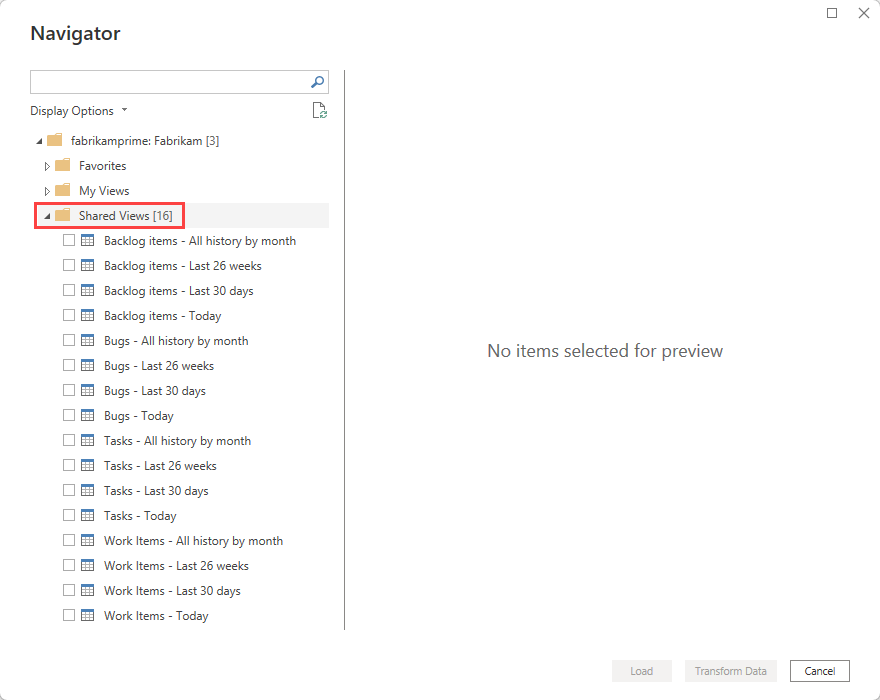
Expand Shared Views. The Data Connector presents a list of available Analytics views. Each view represents a set of data that you can pull into Power BI. You can also create custom Analytics views.
The following image shows the default Analytics views. Your list of views might differ based on the process model used to create your project. All views listed, except the views appended with Today, provide historical trend data.
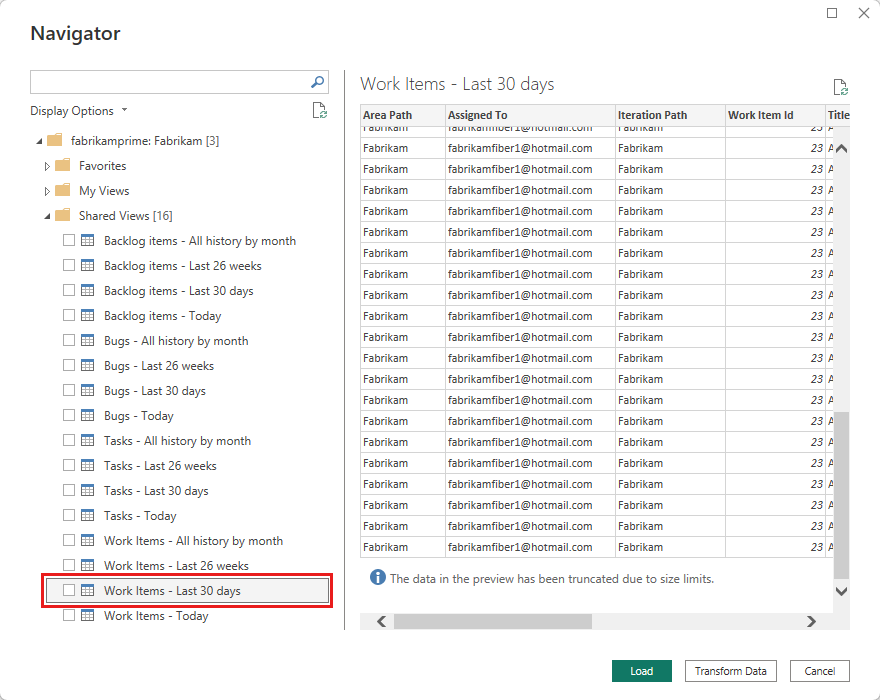
Select the Work Items - Last 30 days view and wait for the preview to load. This view uses a filter to show the last 30 days of history for all work items in the project.
Note
If you verify the view when you create it, the view should load. If the view doesn't load, it's most likely because the dataset is too large. Return to the Analytics views page in the web portal and open the view for editing. Adjust the filters to decrease the size of the dataset.
Note
- The preview shown for any selected view in the navigator can be truncated depending on the number of fields selected and the size of the dataset. The data gets truncated only for the preview and doesn't affect the full data refresh.
- Analytics views don't apply filters defined by using Power BI on the server. Any filters applied in Power BI limit the data shown to end users but don't reduce the amount of data retrieved from Analytics. If the filter is intended to reduce the size of the dataset, apply it by customizing the view.
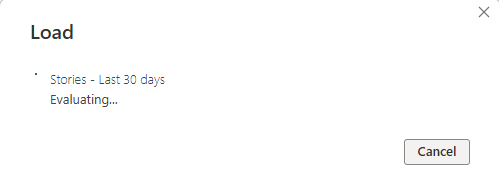
Select the checkbox next to the Stories - Last 30 days view, and then select Load. Wait for the data to load. Monitor its progress through the status messages displayed under the table name. If any errors occur, refer to the FAQs section for solutions to common issues.
Review the data model. While the model loads, review the dataset design for the Power BI Data Connector.
Create a daily trend report
In your report, go to the Visualizations pane, and then select the Line chart visual. In the Data pane, enter work item id in the search field, and then select Work Item Id.

Your data appears in the line chart as a single dot.
Tip
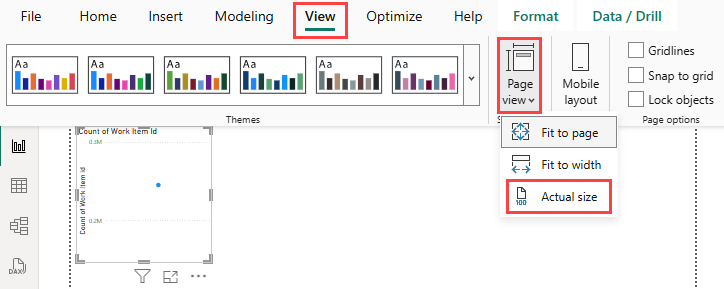
To change the chart size, go to the View tab, select Page view, and then select Actual size. You can then resize the chart to your desired dimensions.
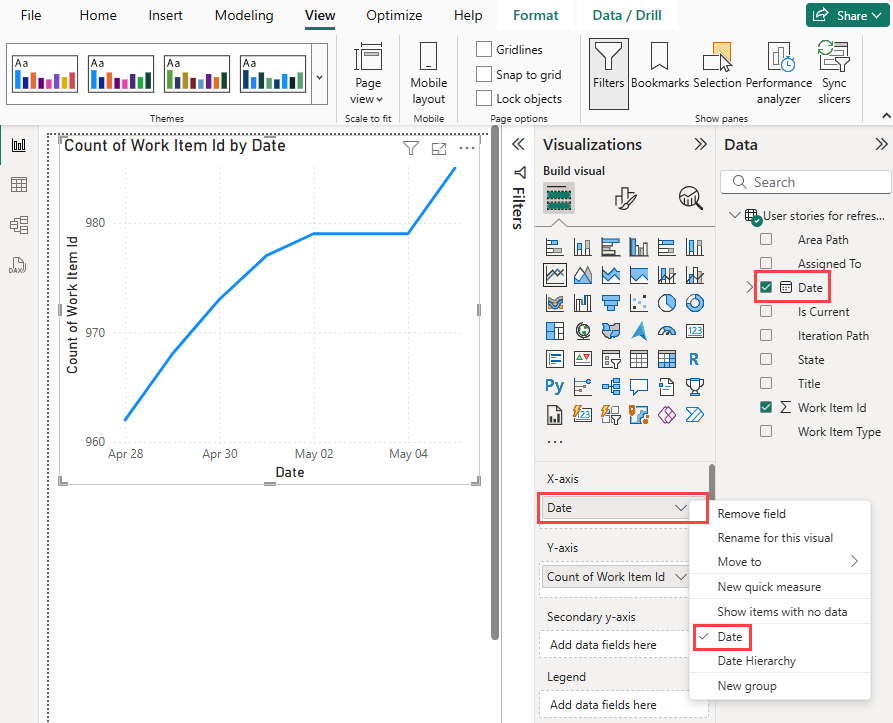
In the Data pane, select the Date field as your axis. By default, Power BI creates a date hierarchy from any date field. To see a daily trend, go to the Visualizations pane. Under X-axis, expand the shortcut menu of the Date field, and then select Date.
Note
To view trends over time, use the Date format, not Date Hierarchy. In Power BI, the Date Hierarchy field organizes dates by level, such as year, quarter, month, or day. For instance, the hierarchy day level categorizes data from all days into numbers between 1 and 31. As a result, counts from April 3 and May 3 are both assigned to number 3. The result isn't the same as counting the items on each date.


Group and filter the trend by state
To group your user stories by state, drag the State field into the Legend area. Optionally, filter the set of states to show in the chart.
The following chart uses a filter that allows work items in the Active, Closed, and Committed states. Each line shows a daily distinct count of user stories in one of those states.

Tip
If you need to modify your Analytics view, you can do so and then return to your Power BI report. To refresh the data, select Refresh.

Create a card to show the latest active stories count
Add a new page by selecting the plus sign (+) at the bottom of the page.
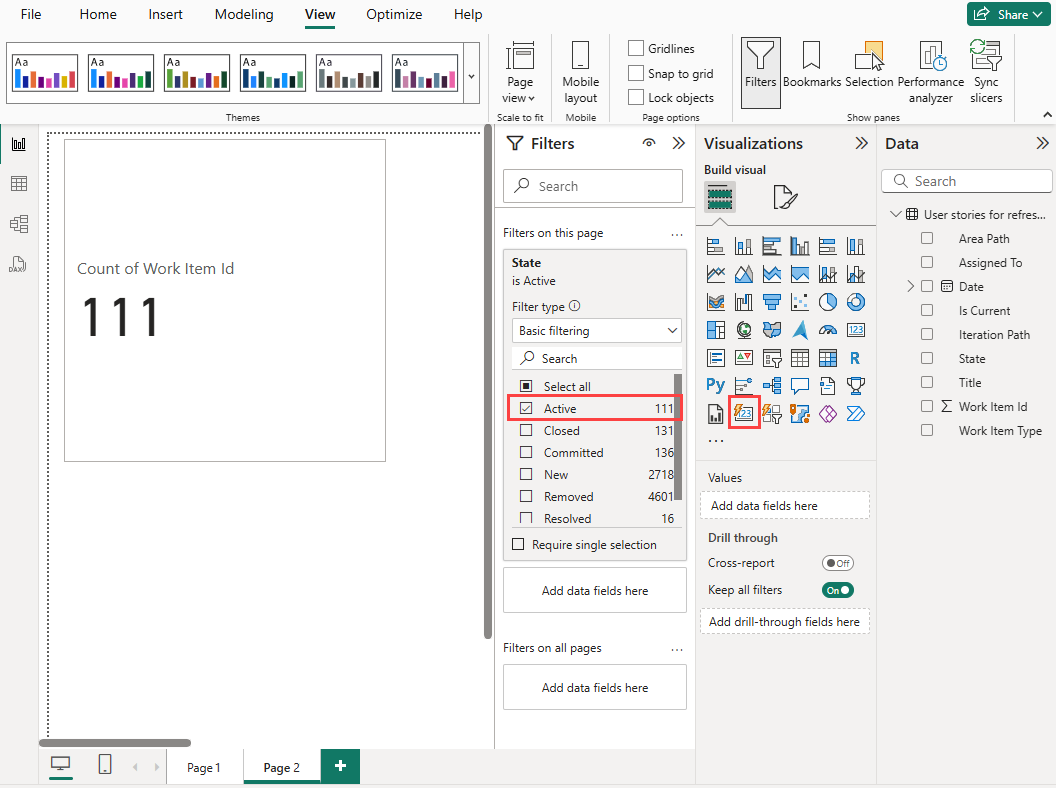
Select the card visual, and then add the Work Item Id field.
Drag the State field into the Filters on this page area of the Filters pane. Set a filter on the State field to show only Active items.
The card shows the number of active user stories multiplied by the number of days each one was defined during the past 30 days. For this example, that number is 111.
To get the latest count of active user stories, filter the card to count only the latest revision of the user stories:
- Drag the Is Current field into the Filters on this page area of the Filters pane.
- On the Is Current filter, select True to allow only the data for the latest day.
The Is Current field is automatically added to the view to mark the rows that contain the latest revision of each user story. Applying this filter brings the Active user story count to 16.
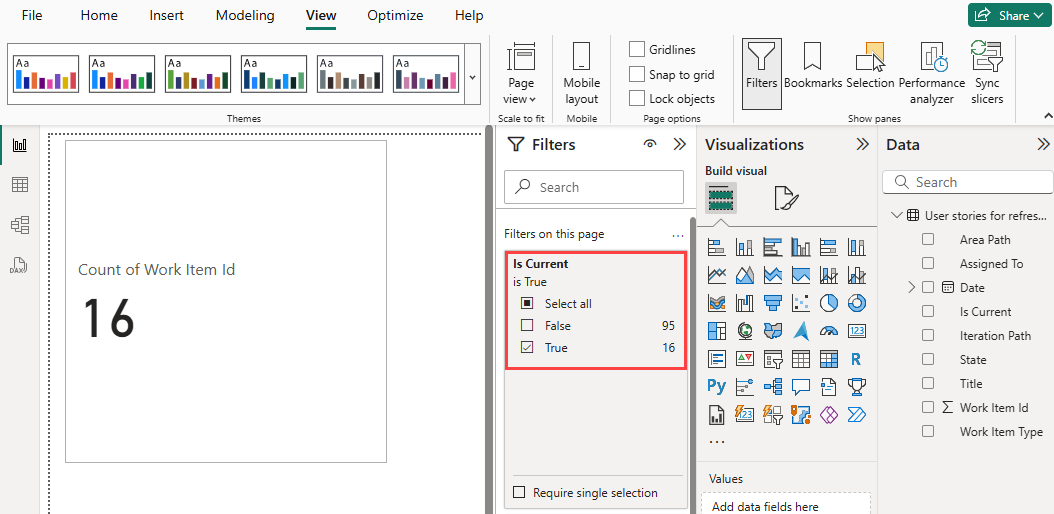
The value should match the count on the last day of the trend chart that you created in the previous section.


Continue to explore your data
The reports shown in this quickstart illustrate how Analytics views make it easy to generate reports of your work-tracking data.