Note
Access to this page requires authorization. You can try signing in or changing directories.
Access to this page requires authorization. You can try changing directories.
Azure DevOps Services | Azure DevOps Server | Azure DevOps Server 2022 | Azure DevOps Server 2020
Learn how to establish a seamless connection between Power BI and Azure DevOps using the Power BI Data Connector. This integration lets you extract valuable insights from your Azure DevOps data and create compelling reports and dashboards within Power BI using Analytics views.
Important
Analytics views only support Azure Boards data (work items). Analytics views don't support other data types, such as pipelines. Views provide a flat list of work items and don't support work item hierarchies. At this point, there are no plans to update the connector to support other types of data. For information on other approaches, see About Power BI integration.
The Power BI Data Connector provides a direct connection to Azure DevOps Analytics, allowing you to do the following tasks:
- Import Analytics views into Power BI Desktop
- Create custom reports with real-time Azure DevOps data
- Build interactive dashboards for stakeholders
- Track project metrics and team performance
- Visualize work item trends and sprint progress
Prerequisites
Ensure you meet the following requirements before connecting Power BI to Azure DevOps Analytics:
| Category | Requirements |
|---|---|
| Access levels | - Project member - At least Basic access level |
| Permissions | - Analytics permissions - Contributors group membership provides required permissions |
| Tools | - Azure Boards enabled - Power BI Desktop (latest version recommended) |
| Preparation | - Understanding of Analytics concepts - Analytics view created for your reporting needs - Familiarity with Power BI fundamentals |
| Category | Requirements |
|---|---|
| Access levels | - Project member - At least Basic access level |
| Permissions | - Analytics permissions - Contributors group membership provides required permissions |
| Tools | - Analytics installed and enabled - Azure Boards enabled - Power BI Desktop (latest version recommended) |
| Preparation | - Understanding of Analytics concepts - Analytics view created for your reporting needs - Familiarity with Power BI fundamentals |
Important
Azure DevOps doesn't support Alternate Credentials authentication. If you're still using Alternate Credentials, we strongly encourage you to switch to a more secure authentication method.
Connect to an Analytics view
Follow these steps to connect to an Analytics view:
Open Power BI Desktop.
Sign in to the service. First-time access requires you to sign in and authenticate your credentials. Power BI Desktop saves your credentials, so you only have to sign in once.
Note
Azure DevOps doesn't support cross-tenant scenarios that use Open Authorization (OAuth). Instead, use service principals and managed identities.
Select Connect.

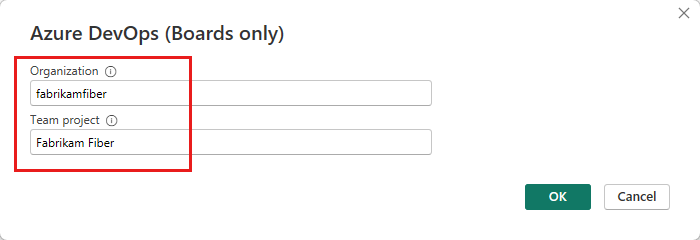
Select Get Data > Online Services, and then select Azure DevOps (Boards only) for cloud services or Azure DevOps Server (Boards only) for an on-premises server. Select Connect. Analytics views support queries only against work items and test cases.

Specify the basic parameters to connect to your data.

- Collection URL: Enter the URL where your Azure DevOps Server instance is hosted. An example URL is
https://fabrikam-server/AzureDevOpsServer/fabrikam-collection. - Team project: Enter only the project name. For example, enter Fabrikam-Fiber if the URL of your Azure DevOps Server instance is
https://fabrikam-server/AzureDevOpsServer/fabrikam-collection/Fabrikam-Fiber.
Important
Don't confuse the team name with the project name, which is a common mistake. For example, if the URL you use is
https://fabrikam-server/AzureDevOpsServer/fabrikam-collection/Fabrikam-Fiber-Git/Device, Fabrikam-Fiber-Git is the project name, and Device is the team name.After you successfully sign in, Power BI verifies that your credentials have the permissions that are needed to access the specified project. For solutions to common issues, see Troubleshooting.
- Collection URL: Enter the URL where your Azure DevOps Server instance is hosted. An example URL is
Select the Analytics view
Follow these steps to select the Analytics view:
Expand Shared Views. The Data Connector presents a list of available Analytics views. Each view represents a set of data that you can pull into Power BI. You can also create custom Analytics views.
The following image shows the default Analytics views. Your list of views might differ based on the process model used to create your project. All views listed, except the views appended with Today, provide historical trend data.
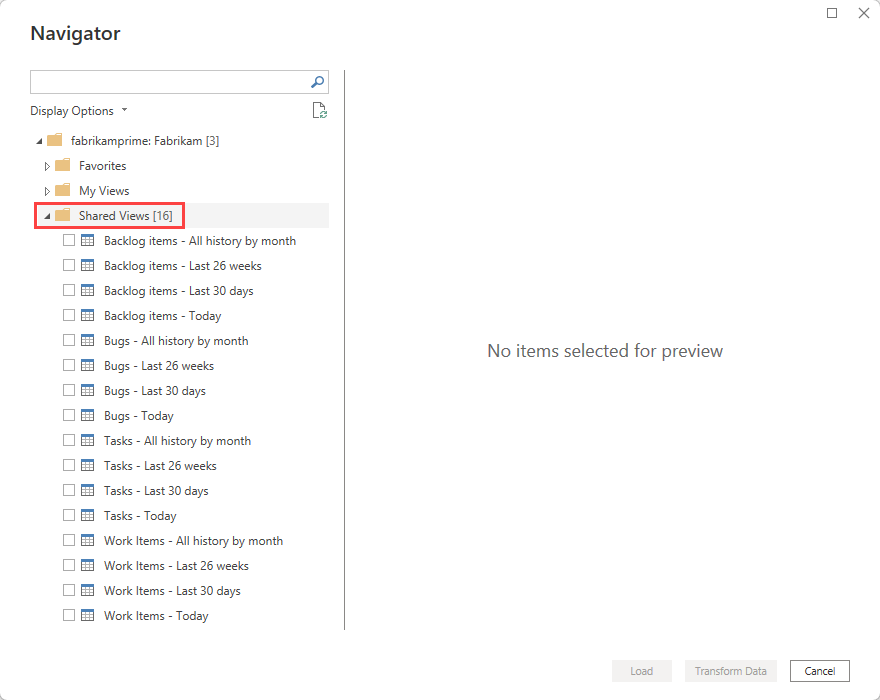
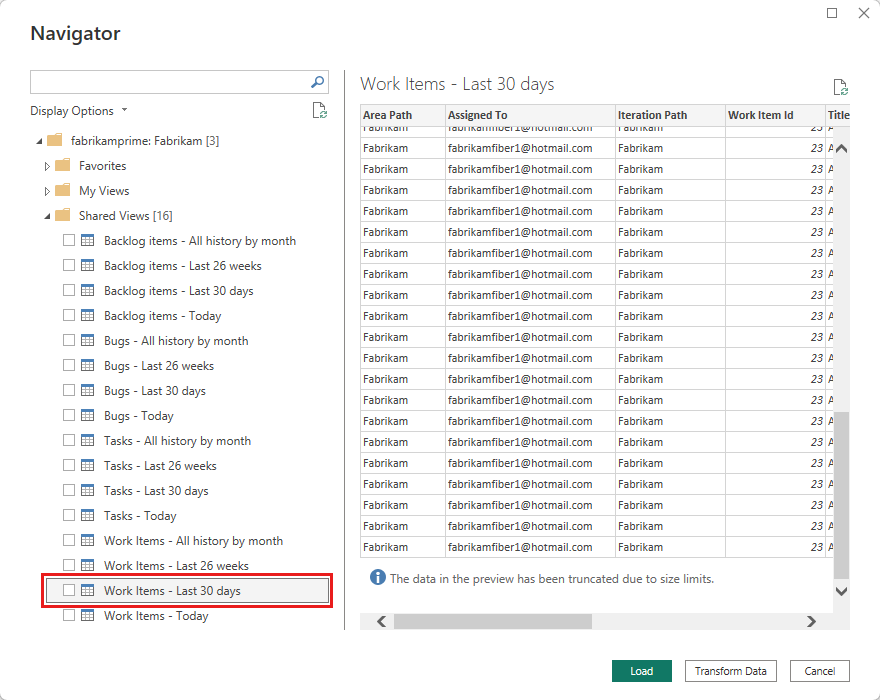
Select the Work Items - Last 30 days view and wait for the preview to load. This view uses a filter to show the last 30 days of history for all work items in the project.
Note
If you verify the view when you create it, the view should load. If the view doesn't load, it's most likely because the dataset is too large. Return to the Analytics views page in the web portal and open the view for editing. Adjust the filters to decrease the size of the dataset.
Note
- The preview shown for any selected view in the navigator can be truncated depending on the number of fields selected and the size of the dataset. The data gets truncated only for the preview and doesn't affect the full data refresh.
- Analytics views don't apply filters defined by using Power BI on the server. Any filters applied in Power BI limit the data shown to end users but don't reduce the amount of data retrieved from Analytics. If the filter is intended to reduce the size of the dataset, apply it by customizing the view.
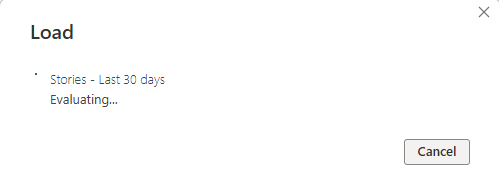
Select the checkbox next to the Stories - Last 30 days view, and then select Load. Wait for the data to load. Monitor its progress through the status messages displayed under the table name. For solutions to common issues, see Troubleshooting.
Review the data model. While the model loads, review the dataset design for the Power BI Data Connector.
Create reports and dashboards
After successfully loading your Analytics data, you can create various reports and visualizations:
Get started with report creation
- Explore your data: Review the imported fields and understand the data structure
- Plan your visualizations: Identify key metrics and KPIs you want to track
- Create initial reports: Start with simple charts and gradually add complexity
- Test and iterate: Validate your reports with stakeholders and refine as needed
Common report types
- Work item trends: Track bug reports, user stories, and feature progress over time
- Sprint burndown charts: Monitor sprint progress and team velocity
- Team performance metrics: Analyze throughput, cycle time, and completion rates
- Backlog analysis: Visualize work distribution and priority alignment
For detailed examples and templates, see Example reports based on Analytics views.

Best practices
To get the most out of your Power BI and Analytics integration:
Performance optimization
- Filter your Analytics views to include only necessary data
- Use appropriate date ranges to limit data volume
- Refresh data regularly but avoid excessive refresh frequency
- Consider data refresh schedules that align with your reporting needs
Report design
- Start simple and add complexity gradually
- Use consistent formatting and branding across reports
- Include context and explanations for metrics
- Test with different user personas to ensure usability
Data governance
- Document your Analytics views and their purposes
- Establish data refresh policies and ownership
- Monitor report usage and performance
- Maintain security and access controls
Troubleshooting
Common error scenarios
Query result exceeds maximum size
Error message: "Query result exceeds maximum size. Reduce the number of records by applying additional filters"
Cause: Your Analytics view returns more than 250,000 records.
Solutions:
- Reduce the time range in your Analytics view
- Apply additional filters to limit work item types or states
- Use multiple smaller views instead of one large view
- Consider aggregating data at a higher level

Access denied or authentication errors
Error message: "The user is not authorized" or authentication failures
Possible causes and solutions:
- Check project permissions: Verify you have access to the Azure DevOps project
- Validate Analytics permissions: Ensure you have Analytics access
- Review credentials: Work with your administrator for credential issues
- Microsoft Entra authentication: Verify your account is properly configured

Analytics access forbidden
Error message: "Access to the resource is forbidden"
Resolution: Contact your project administrator to grant View analytics permission. See Analytics security for details.

Project not found
Error message: "Project 'X' does not exist or you do not have permissions to access it"
Common causes:
- Incorrect project name: Ensure you're using the project name, not the team name
- URL confusion: For
https://dev.azure.com/fabrikam/MyProject/MyTeam, use "MyProject" not "MyTeam" - Missing permissions: Verify you have access to the specified project

Reading error messages
When you troubleshoot Power BI Data Connector issues, do the following tasks:
- Look for the root cause: Search for [DataSource.Error] in the error message
- Ignore wrapper text: Focus on the core error description
- Check suggested actions: Error messages often include resolution steps
- Verify prerequisites: Ensure all requirements are met