Note
Access to this page requires authorization. You can try signing in or changing directories.
Access to this page requires authorization. You can try changing directories.
This article explains how to set up anomaly detection in Real-Time Intelligence to automatically identify unusual patterns and outliers in your Eventhouse tables. The system provides recommended models and allows you to set up continuous monitoring with automated actions.
Key capabilities include:
- Model recommendations: Suggests the best algorithms and parameters for your data.
- Interactive anomaly exploration: Visualize detected anomalies and adjust model sensitivity.
- Continuous monitoring: Set up real-time anomaly detection with automated notifications.
- Reanalysis with new data: Update your models as new data arrives to improve accuracy.
Important
This feature is in preview.
Prerequisites
- A workspace with a Microsoft Fabric-enabled capacity
- Role of Admin, Contributor, or Member in the workspace
- An Eventhouse in your workspace with a KQL database
- A Python plugin enabled on that same Eventhouse
- To enable the plugin, navigate to your Eventhouse.
- In the upper toolbar, select Plugins and then enable the Python language extension.
- Select the Python 3.11.7 DL plugin and click Done.

Note
Ensure your Eventhouse table contains sufficient historical data to improve model recommendations and anomaly detection accuracy. For example, datasets with one data point per day require a few months of data, while datasets with one data point per second might only need a few days.
How to set up anomaly detection
Start anomaly detection from an Eventhouse table
You can start anomaly detection in two ways:
From the Real-Time hub:
Select Real-Time hub in the left navigation pane.

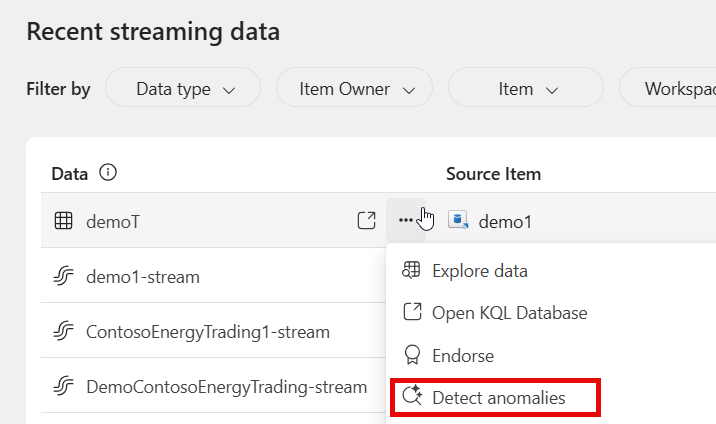
Locate the table you want to analyze for anomalies and do either of the following steps:
Select the ⋯ (three dots) to open the table's ribbon menu, and select Anomaly detection.
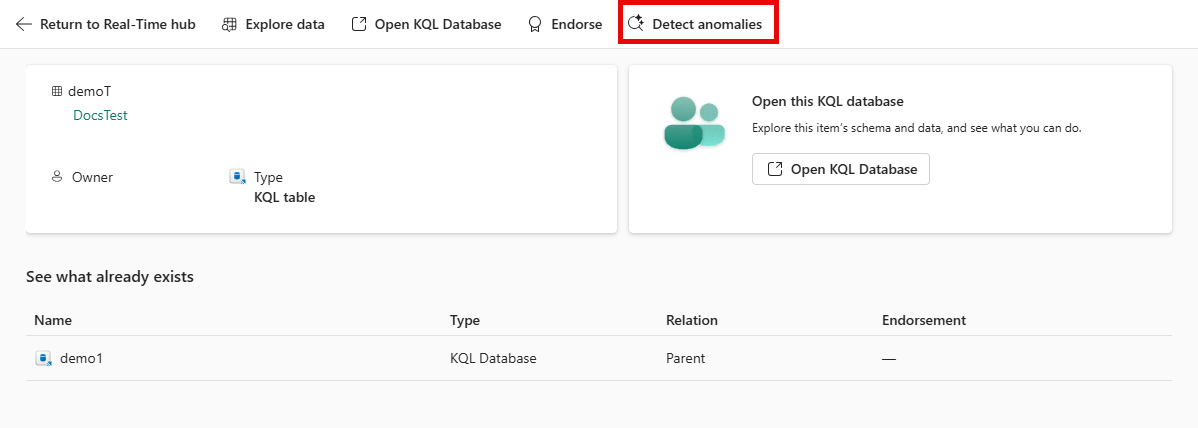
Select the table to open the details page. In the upper toolbar, select Anomaly detection.
From the Create button:
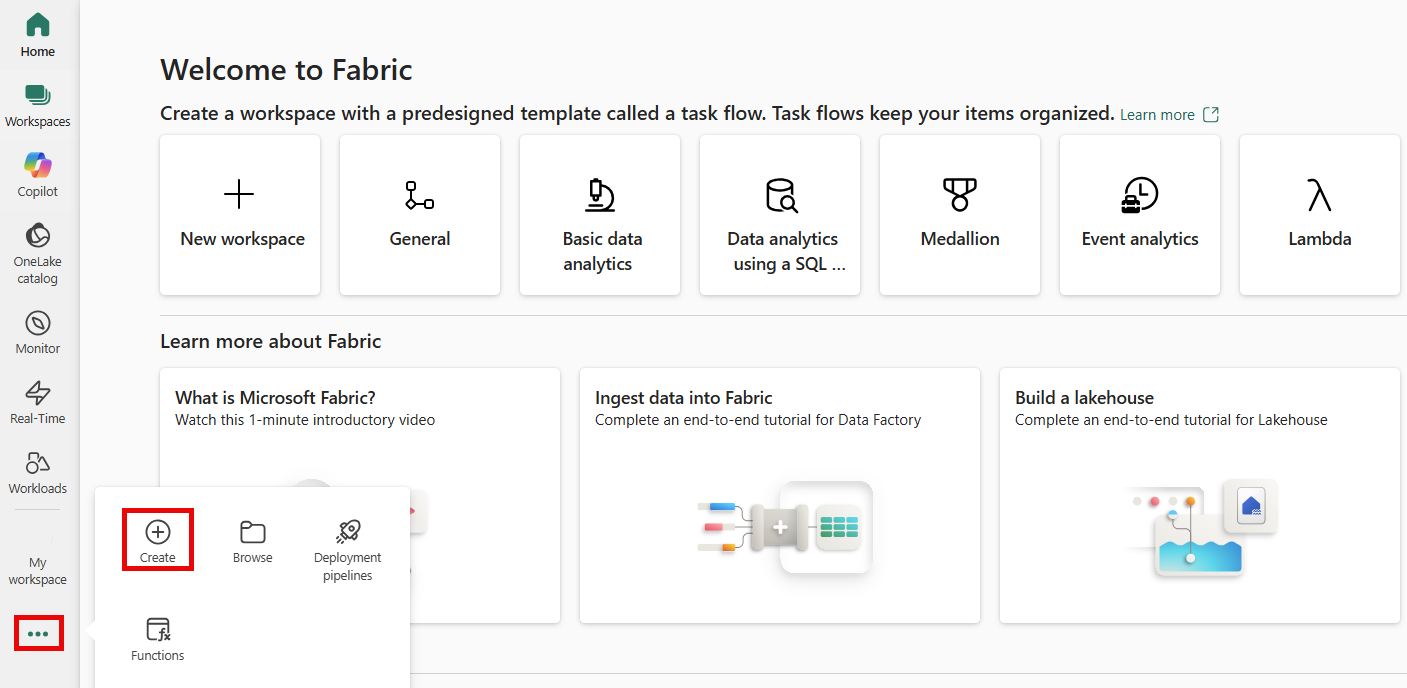
In the Fabric home page, select the ellipses (...) icon and then the Create option.
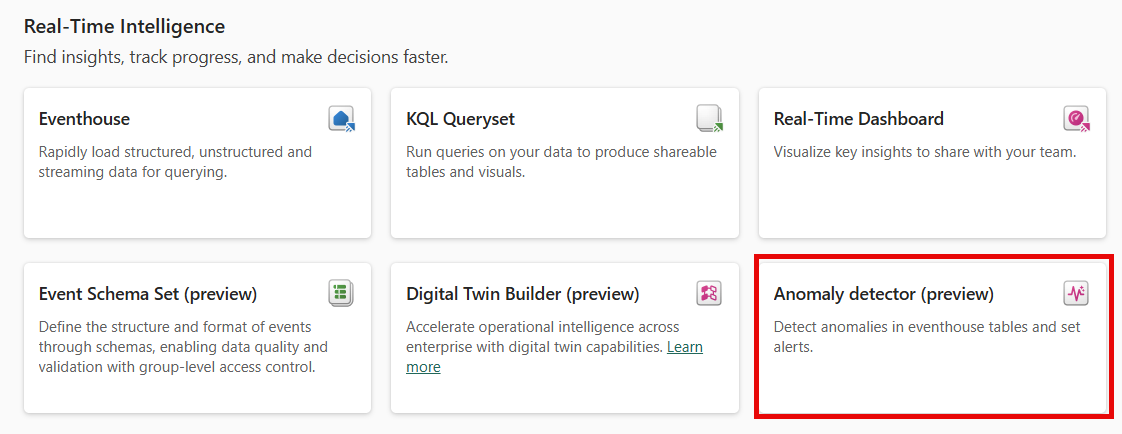
In the Create pane, select Anomaly detection under the Real-Time Intelligence section.
Configure input columns for analysis
Specify which columns to analyze and how to group your data.
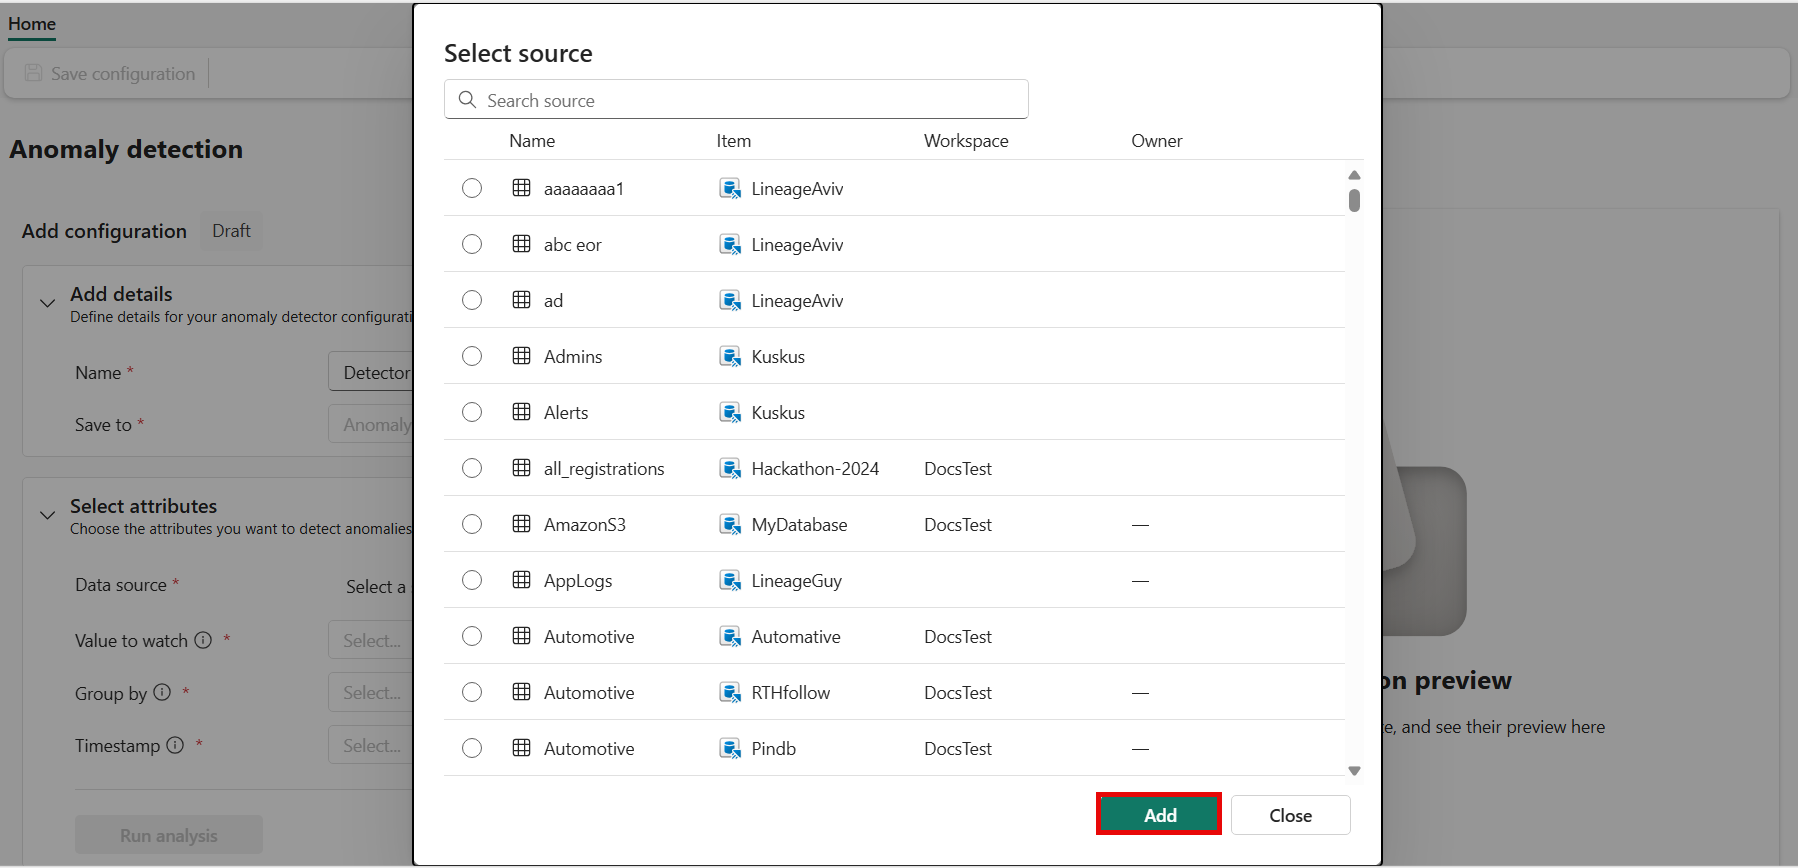
In the Anomaly detection configuration pane, select the Data source you want to analyze.
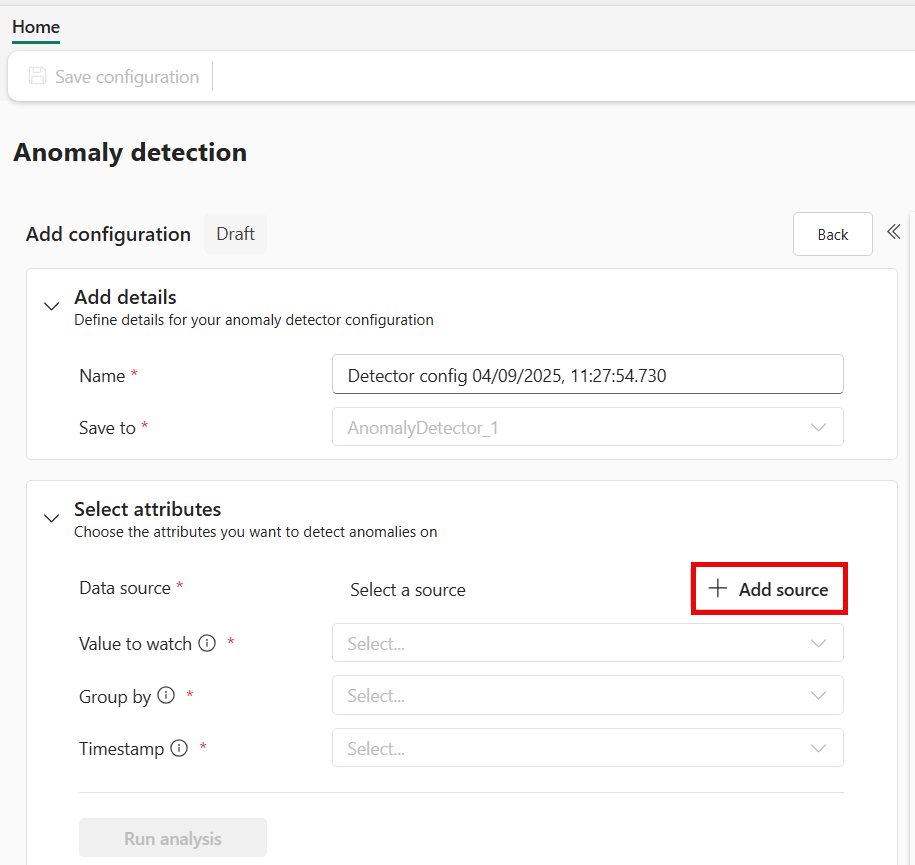
In the Select source pane, choose the Eventhouse and table you want to analyze, then select Add.
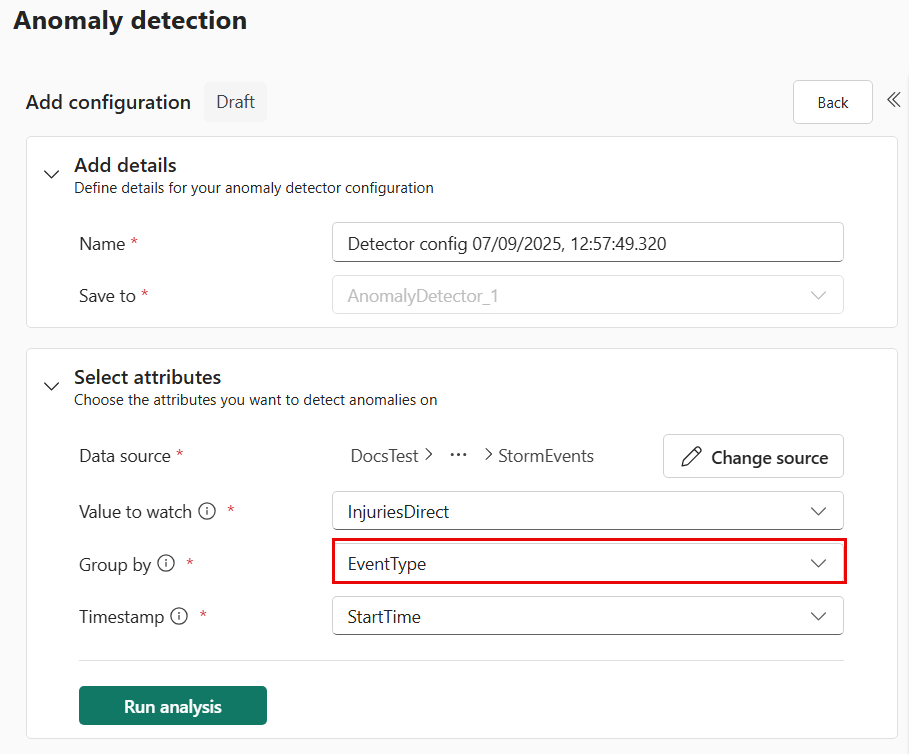
In the configuration pane, add the Value to watch column that contains the numeric data you want to monitor for anomalies.

Note
Ensure the selected column contains numeric values, as only numeric data is supported for anomaly detection.
Choose the Group by column to specify how your data should be partitioned for analysis. This column typically represents entities such as devices, locations, or other logical groupings.
Select the Timestamp column that represents the time each data point was recorded. This column is crucial for time-series anomaly detection and ensures accurate analysis of trends over time.
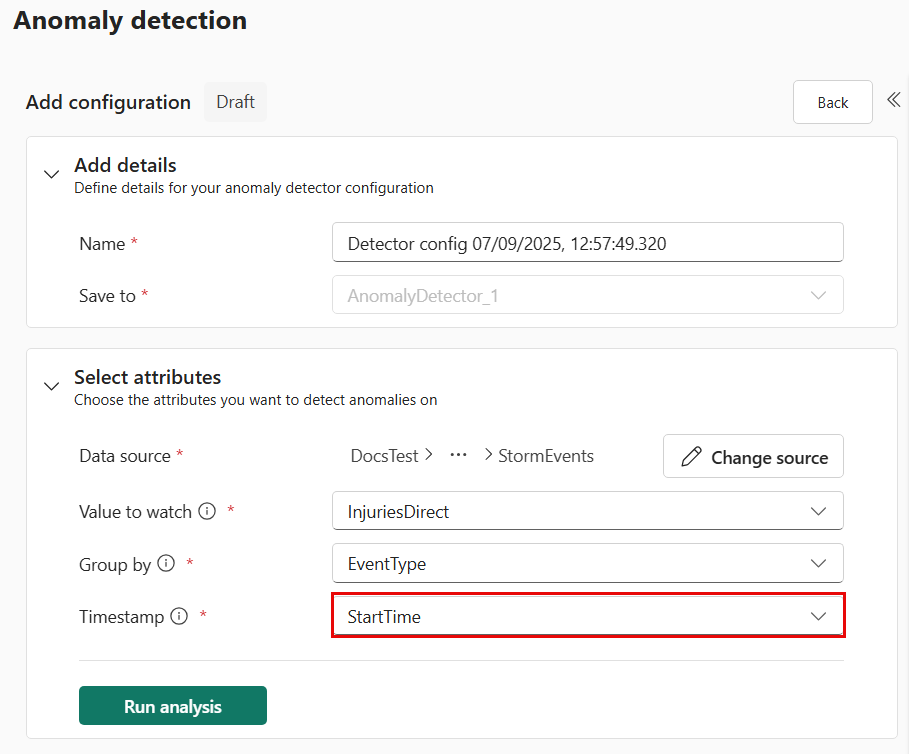
Select Run analysis to begin the automated model evaluation.
Wait for analysis completion
The system analyzes your data to find the best anomaly detection models.
Important
Analysis typically takes up to 4 minutes depending on your data size and can run for up to 30 minutes. You can navigate away from the page and check back in when the analysis is complete.
During analysis, the system:
- Samples your table data for efficient processing
- Tests multiple anomaly detection algorithms
- Evaluates different parameter configurations
- Identifies the most effective models for your specific data patterns
Review recommended models and anomalies
Once the analysis is complete, you can review the results and explore the detected anomalies.
Open the anomaly detection results by selecting the notification you received or navigating back to the table and selecting View anomaly results.
The results page provides the following insights:
- A visualization of your data with anomalies clearly highlighted.
- A list of recommended algorithms, ranked by their effectiveness for your data.
- Sensitivity settings to adjust the detection thresholds.
- A detailed table of detected anomalies within the selected time range.
Use the model selector to compare the performance of different recommended algorithms and choose the one that best fits your needs.
Adjust the sensitivity settings to refine the anomaly detection results:
- Options include Low, Medium, and High Confidence levels.
- Experiment with these settings to balance between detecting more anomalies and reducing false positives.
Interact with the visuals and tables to gain deeper insights into the detected anomalies and understand the patterns in your data.
Save the anomaly detector to preserve your configuration and revisit it later.
Publish the detected anomalies to the Real-Time Hub to enable continuous monitoring of incoming data. You can also configure downstream actions, such as sending alerts to Activator.
By reviewing and fine-tuning the results, you can ensure that your anomaly detection setup is optimized for your specific use case.
Reanalyze anomaly detection models with new data
Keep your anomaly detection models up to date as new data becomes available.
Follow the steps to reanalyze the model with new data:
- Navigate to your anomaly detection item.
- In the Edit panel, modify any of the previously filled-out fields as needed.
- Select Run analysis. This triggers a new analysis based on your updated inputs.
Warning
Reanalyzing will update the model used by existing monitoring rules, which may impact downstream actions.
Limitations and considerations
Be aware of these current limitations:
- Data requirements: Sufficient historical data improves model recommendations and accuracy
- Each anomaly detector can only support a single model configuration.
Running multiple operations in the anomaly detector
When you interact with the anomaly detector, Eventhouse runs Python queries in the background to support real-time analysis. These operations include:
- Running anomaly detection or other types of analysis.
- Switching between recommended models.
- Changing the time window or IDs being viewed.
- Continuously monitoring incoming data for anomalies by setting alerts.
Eventhouse supports up to eight concurrent queries per Eventhouse. If this limit is exceeded, the system retries the queries, but additional queries won’t be queued and might silently fail. Error messages to provide more clarity are under development.
To avoid issues:
- Allow each query to complete before starting a new one.
- If performance seems slow or unresponsive, reduce the number of concurrent queries.
For more information, see Python Plugin.
Wait times for enabling the Python Plugin
When you start data analysis, the anomaly detector automatically enables the Python Plugin on your Eventhouse. Enabling the plugin can take up to one hour. Once enabled, the analysis begins automatically.
For more information, see Enable Python plugin in Real-Time Intelligence.
Next steps
Now that you have anomaly detection configured, explore related capabilities:
- Learn about multivariate anomaly detection
- Explore multivariate anomaly overview
- Create alerts from a KQL queryset
- Set up Data Activator for automated responses