Note
Access to this page requires authorization. You can try signing in or changing directories.
Access to this page requires authorization. You can try changing directories.
In digital twin builder (preview), the explorer lets you identify assets from keywords, explore asset details, and visualize time series data. After you complete the mapping stage in your digital twin builder, you should see assets populate in the explorer.
Important
This feature is in preview.
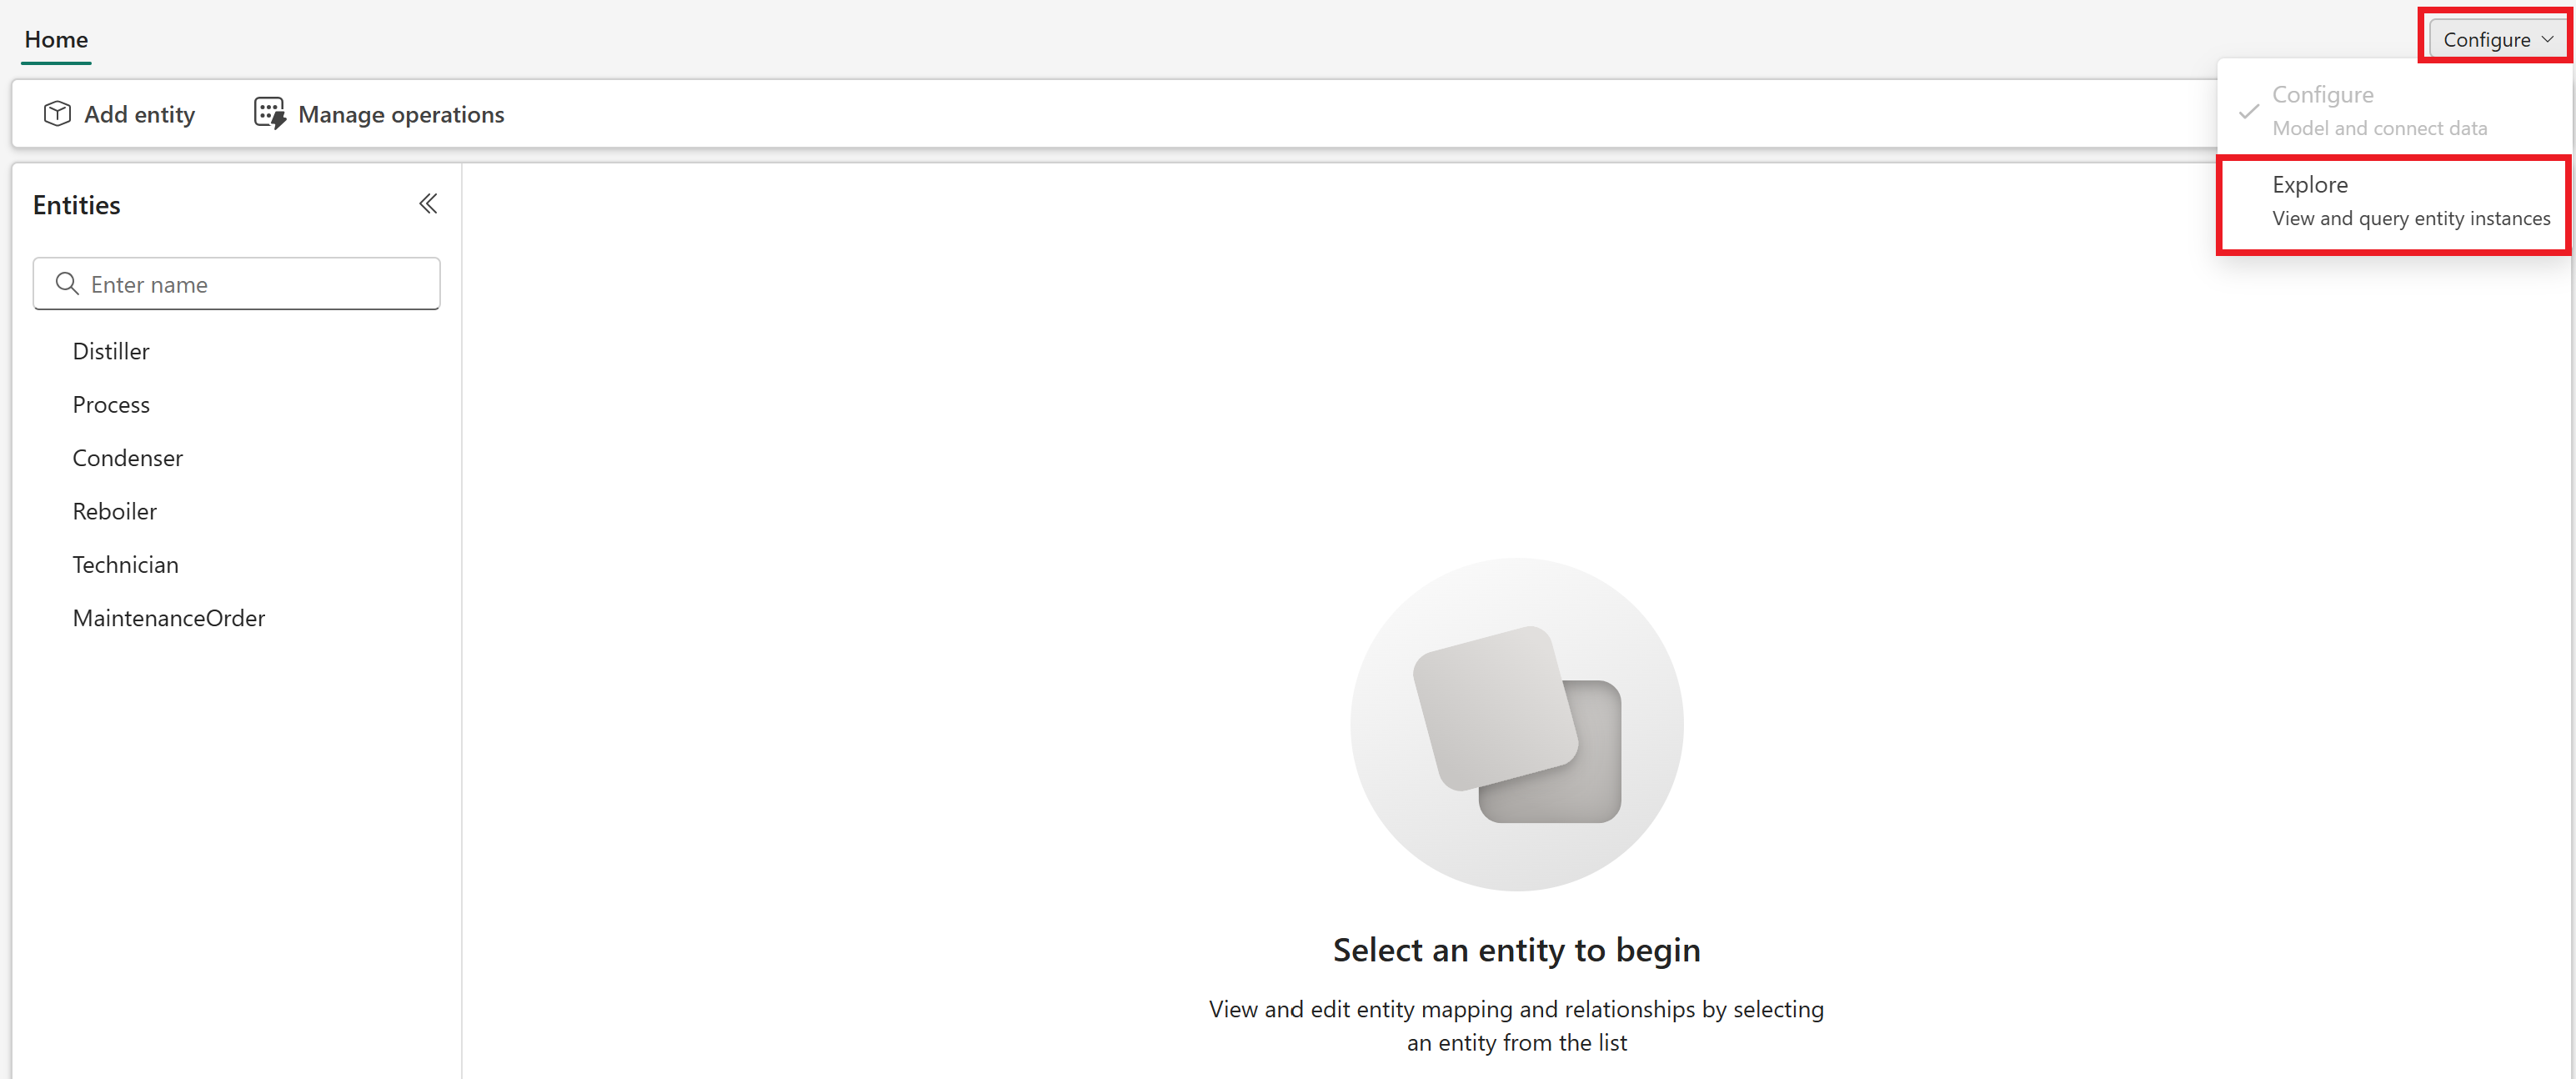
Access the explorer by selecting Explore entity instances from the menu ribbon in the semantic canvas.
Here are the top scenarios for using the explorer:
- Efficient data retrieval with keyword search experience
- Robust asset exploration with card view
- Time series charts for easy data comparison and historical analysis
Prerequisites
- A workspace with a Microsoft Fabric-enabled capacity.
- Your desired data in a Fabric lakehouse with the necessary ETL done.
- Time series data should be in columnar format. Columnar time series data is structured so that each column represents a different variable or attribute, while each row corresponds to a specific timestamp.
- A digital twin builder (preview) item with data mapped to it from a lakehouse.
Access the explorer
You can access the explorer from the digital twin builder (preview) semantic canvas, by selecting Explore entity instances from the menu ribbon.
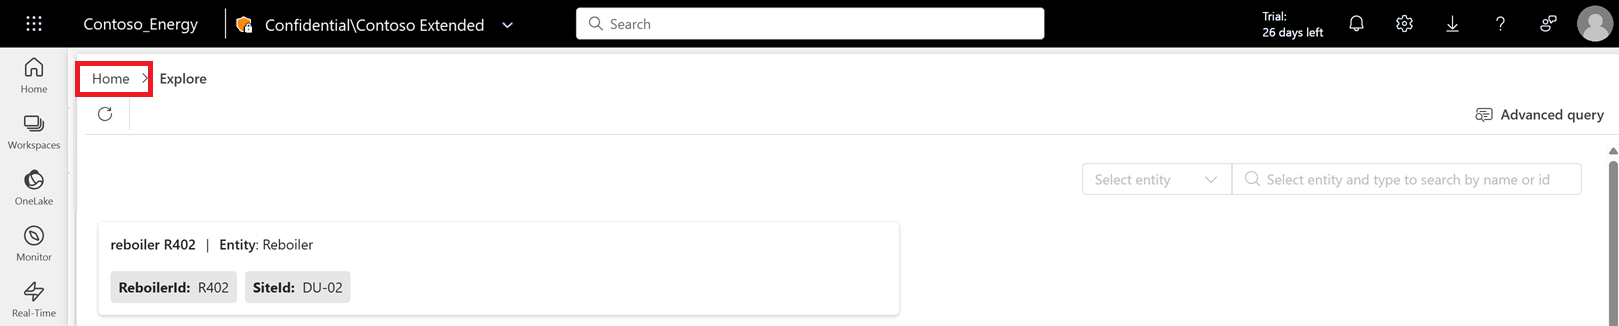
To leave the explorer and return to the semantic canvas, select Home in the top left corner of the explorer view.
Explore assets
The explorer contains multiple view options.
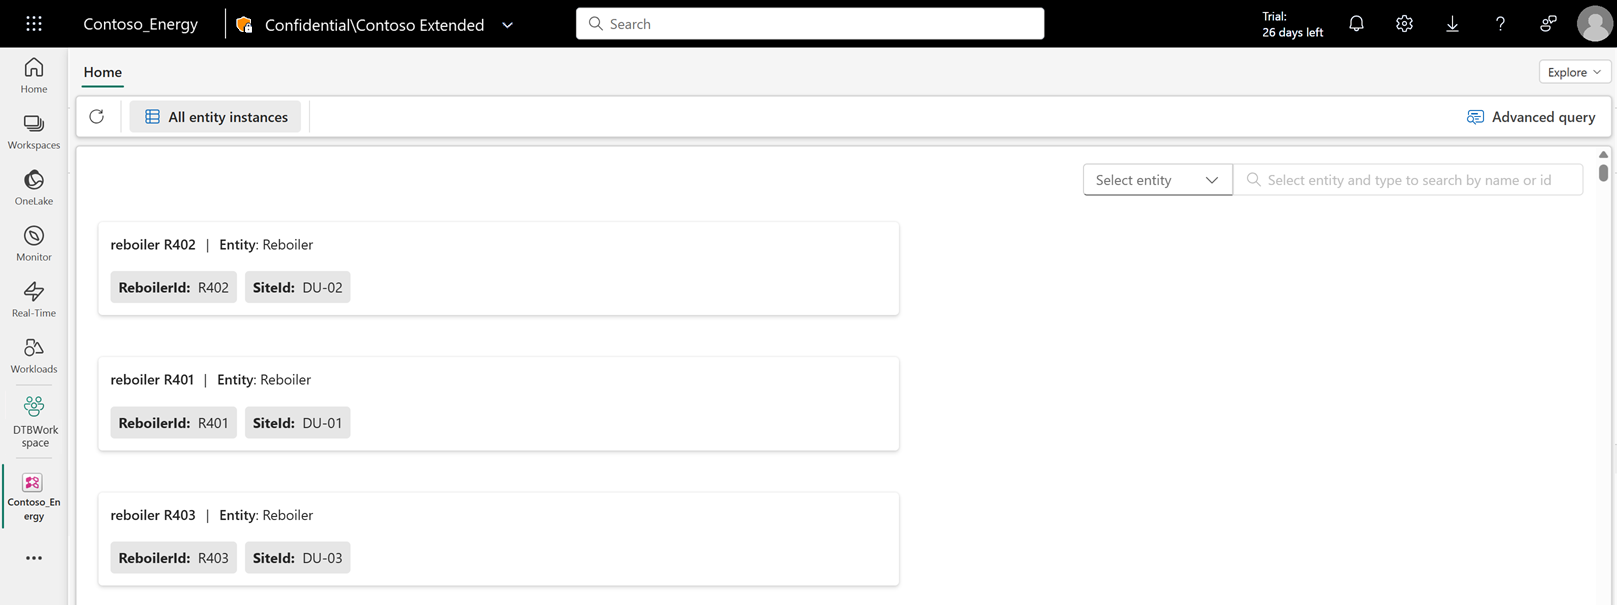
Card view
The card view displays all assets in list format. You can see details such as name, entity type, and properties associated with each asset. The card view is the explorer's default view.

Details view
While in the card view, select an asset card to open the Details view.
This page shows all information related to the assets, such as properties and time series data, all in one place.

To return to the main explorer view, select Explore in the top left.

Time series
While in the Details view, select the Charts tab to view time series data in chart format.

You can change the data in the chart by selecting different time series properties underneath the chart, changing the aggregate function selection, or changing the date range. Multiple time series properties can be displayed on the chart at once.
Use entity and keyword search
In the Card view, the entity type selector and keyword search box allow you to find matches in your assets across the Entity, Name, and Unique ID fields.

Use advanced query
The no-code advanced query builder allows you to filter the card view even further, by querying based on entity type properties and allowing you to add multiple filters.
