Note
Access to this page requires authorization. You can try signing in or changing directories.
Access to this page requires authorization. You can try changing directories.
Azure DevOps Services | Azure DevOps Server | Azure DevOps Server 2022 | Azure DevOps Server 2020
Analytics is the reporting platform for Azure DevOps, replacing the previous platform based on SQL Server Reporting Services. Built specifically for reporting, Analytics is optimized for fast read-access and server-based aggregations. Use it to answer quantitative questions about the past or present state of your projects and gain actionable insights from your development data.
Analytics transforms raw Azure DevOps data into meaningful insights that help teams make data-driven decisions, track progress, identify trends, and improve their development processes.
Note
If you're looking for information about Azure Analysis Services, see Azure Analysis Services.
Key capabilities of Analytics
Analytics provides comprehensive insights about your projects through multiple access methods:
- Analytics widgets that you can add to your dashboards for immediate insights
- In-context Analytics reports available from select Azure DevOps pages
- Rollup bars and counts for Azure Boards backlogs to track progress
- Custom reports you can create using Power BI for advanced analytics
- Custom reports you can create using OData queries for programmatic access
- Extensibility support to develop and add your custom Analytics widgets to dashboards
Why choose Analytics over traditional reporting?
Analytics offers several advantages over legacy reporting solutions:
- Real-time data: Analytics automatically updates as your Azure DevOps data changes
- Optimized performance: Built for fast queries and aggregations
- Modern interface: Native integration with Power BI and OData standards
- Extensible: Support for custom fields, work item types, and widgets
- Cloud-ready: Designed for both cloud and on-premises deployments
Note
The Analytics service is automatically enabled and supported in production for all services within Azure DevOps Services. Power BI integration and access to the OData feed of the Analytics service are generally available. You're encouraged to use the Analytics OData feed and provide feedback.
Available data is version-dependent. The latest supported version of the OData API is v2.0, and the latest preview version is v4.0-preview. For more information, see OData API versioning.
Note
The Analytics service is automatically installed and supported in production for all new project collections for Azure DevOps Server 2020 and later versions. Power BI integration and access to the OData feed of the Analytics service are generally available. You're encouraged to use the Analytics OData feed and provide feedback. If you upgrade from Azure DevOps Server 2019, you can install the Analytics service during upgrade.
Available data is version-dependent. The latest supported version of the OData API is v2.0, and the latest preview version is v4.0-preview. For more information, see OData API versioning.
Data available in Analytics
Analytics is generally available for Azure DevOps Services and Azure DevOps Server 2020 and later versions. It is in preview for Azure DevOps Server 2019. The service provides a comprehensive data model over Azure DevOps functionality.
Data available via the Analytics service depends on your version and platform. For specifics, read Data available in Analytics and Data model for Analytics.
Data coverage by feature area
Analytics covers the following Azure DevOps feature areas:
| Feature Area | Data Available | Use Cases |
|---|---|---|
| Work Tracking | Work items, areas, iterations, teams, users | Status reports, trend analysis, burndown charts |
| Pipelines | Build/release data, test results, deployment metrics | Pipeline analytics, failure analysis, performance tracking |
| Test Management | Test plans, test results, test configurations | Test coverage, quality metrics, execution trends |
| Version Control | Commit data, branch information | Code activity, repository insights |
Analytics automatically enables for all Azure DevOps Services projects and populates itself with all available Azure DevOps data. Once populated, it continuously updates itself as data changes occur. For more information, read Data available in Analytics and Performance and latency.
Analytics enables for all projects on new project collections and automatically populates itself with all available Azure DevOps data. Once populated, it continuously updates itself as data changes occur. For more information, read Data available in Analytics and Performance and latency.
Dashboard widgets
You can create dashboards and add widgets to them. We provide several widgets based on Analytics. These widgets take advantage of Analytics' power and provide the easiest way to get insights from your data.
Example: Velocity widget insights
The Velocity widget shown in the following image provides insights into a team's historical performance over six iterations:
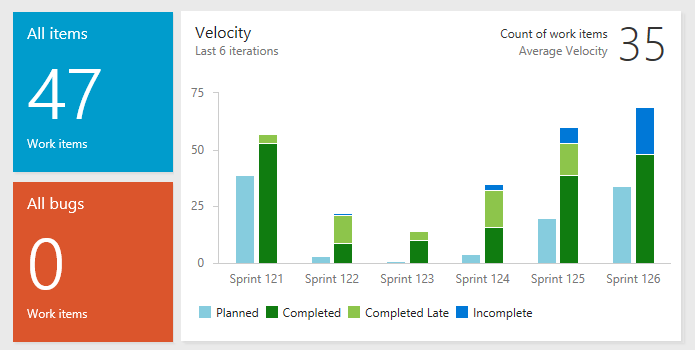
This Velocity widget reveals that this team has a history of closing stories late. It also shows a discrepancy between planned and completed work across all the sprints displayed. The team can drill into the data to determine the root causes. After you implement new practices, the team can use the Velocity widget to track their effectiveness.
Available Analytics widgets
Analytics-powered widgets include:
- Velocity: Track team delivery over time
- Burndown: Monitor sprint and release progress
- Cumulative Flow Diagram: Visualize work flow and bottlenecks
- Lead Time: Measure time from idea to delivery
- Cycle Time: Track work item completion time
Check out Add an Analytics widget to a dashboard for a step-by-step guide to get started with the Velocity widget.
In-context reports and rollup columns
Work tracking in-context reports now use Analytics data as their foundation. These reports appear on the Analytics tab of the product and portfolio backlogs and boards. Additionally, there are pipeline and test in-context reports available. For more information, see the following articles:
Work tracking reports
- Cumulative flow - Visualize work flow and identify bottlenecks
- Team velocity - Track team delivery patterns
- View/configure sprint burndown - Monitor sprint progress
Pipeline and test reports
- Pipeline pass rate report - Track build success rates
- Test failures report - Analyze test execution patterns
Rollup functionality
You can add rollup columns to product and portfolio backlogs that provide:
- Progress bars: Visual representation of completion status
- Work item counts: Aggregate counts of child items
- Field summations: Total values for numeric fields
For details, see Display rollup progress or totals.
Analytics views
Analytics views provide a web portal feature that supports filtering work tracking data for status and trend reports. With Analytics views, you can use default or custom views to generate reports in Power BI through a dedicated data connector.
Benefits of Analytics views
- Pre-filtered data: Define filters once and reuse across multiple reports
- Performance optimization: Reduced data transfer and faster report loading
- Version control: Track changes to view definitions over time
- Team collaboration: Share consistent data views across your organization
For more information, see What are Analytics views?.
OData queries and metadata access
Analytics provides full accessibility via OData (Open Data Protocol). From a web browser, you can query the Analytics metadata or data using OData queries, enabling programmatic access to your Azure DevOps data.
OData capabilities
- Direct data access: Query Analytics data without intermediate tools
- Flexible filtering: Apply complex filters and aggregations
- Metadata exploration: Discover available data structures and relationships
- Integration ready: Connect third-party tools and custom applications
To learn how to construct queries, see Construct OData queries for Analytics.
Custom tooling and queries
If you want to prepare custom queries and tooling with our OData API, review Sample reports and quick reference index.
Sample OData scenarios
Common OData query patterns include:
- Retrieving current work item status across projects
- Analyzing historical trends for specific work item types
- Building custom dashboards with real-time data
- Integrating Azure DevOps data with external business intelligence tools
Power BI integration and data connectors
Power BI is a suite of business analytics tools that integrates seamlessly with Azure DevOps Analytics. We provide multiple data connectors to support importing data into Power BI:
Available connectors
- Analytics views: Prefiltered, optimized data views
- OData query: Direct query access for custom scenarios
- OData feed: Real-time data streaming for live dashboards
Power BI advantages
With Power BI, you can:
- Perform advanced analytics: Use Power BI's sophisticated analysis capabilities
- Create beautiful visualizations: Build compelling charts and reports
- Publish enterprise dashboards: Share insights across your organization
- Combine data sources: Integrate Azure DevOps data with other business systems
Getting started with Power BI
To begin using Power BI with Azure DevOps Analytics:
- Read the overview: Power BI integration overview
- Explore samples: Power BI Sample Reports provide quick starts for popular reports
- Choose your connector: Select the appropriate data connector for your needs
- Build your first report: Start with templates and customize for your requirements
Custom fields and work item types support
Analytics automatically incorporates custom fields and custom work item types into the data model. This automatic inclusion ensures that your customizations appear in Analytics without more configuration.
Automatic customization support
- Custom fields: All custom fields automatically appear in the Analytics data model
- Custom work item types: New work item types become available for reporting
- Process customizations: Changes to workflows and rules reflect in Analytics data
- Real-time updates: Customizations appear in Analytics as you make them
Accessing custom data
Through OData queries, you can:
- View properties added through process customization
- Access enumerated lists and allowed values
- Query relationships between custom and standard fields
- Build reports that include your organization-specific data
Performance and scalability
Analytics is designed for high-performance reporting scenarios:
Performance characteristics
- Optimized for read operations: Fast query response times
- Server-side aggregations: Reduced data transfer
- Incremental updates: Only changed data is refreshed
- Caching strategies: Improved response times for frequent queries
Scalability features
- Handles large datasets: Supports organizations with extensive historical data
- Concurrent access: Multiple users can query simultaneously
- Resource management: Automatic throttling prevents system overload
Security and permissions
Analytics respects Azure DevOps security permissions:
- Project-level security: Users see only data they have permission to access
- Work item security: Area path permissions apply to Analytics data
- Read-only access: Analytics provides read-only views of your data
- Azure AD integration: Supports enterprise authentication and authorization