Note
Access to this page requires authorization. You can try signing in or changing directories.
Access to this page requires authorization. You can try changing directories.
[This article is prerelease documentation and is subject to change.]
This article explains how to reconcile data by using the Financial Reconciliation agent.
The Financial Reconciliation agent simplifies the process of reconciling two data sets in Excel workbooks. You can define the data to reconcile, use AI to determine the reconciliation rules, and get a comprehensive report that provides a generative AI summary of the results of the reconciliation process.
The Financial Reconciliation agent can be used in an assistive capacity or autonomously.
- Assistive – The Financial Reconciliation agent can help users "in the moment," as they actively perform a reconciliation.
- Autonomous – The Financial Reconciliation agent can perform the reconciliation autonomously and therefore make the process even more efficient.
Note
The following sections show how to use the Financial Reconciliation agent in an assistive capacity.
To enable autonomous use, you must first create a template. After you complete the steps in the Start working with the Financial Reconciliation agent in Excel section of this article, follow the steps in Use templates to perform reconciliations to create a template.
To use the agent autonomously, follow the steps in Create a new Financial Reconciliation agent.
Start working with the Financial Reconciliation agent in Excel
To start to work with the Financial Reconciliation agent in Excel, follow these steps.
Open an Excel workbook that contains the data that you want to compare. Finance agents let you reconcile two data sets that are represented as tables, and that reside on one or two worksheets in Excel.
On the ribbon, on the Home tab, select the Finance agents add-in to open the Finance agents sidecar.
Note
If the Finance agents add-in isn't visible, or if it's unavailable, follow the instructions in Install Finance agents Add-in (business user-deployed).
Select data for reconciliation
To start the process and select data for reconciliation, follow these steps.
- In the sidecar, select Financial Reconciliation.
- On the Tables card, the Financial Reconciliation agent automatically suggests worksheets and tables for the reconciliation process. If the suggested worksheets and tables are correct, move on to the Define the Reconciliation vectors section. Otherwise, remove any incorrect worksheet and table by selecting the X next to its name. To add the correct worksheet and table, select Add, and then select the worksheet and table in the list.
Note
The worksheets and table references are populated according to their order in the workbook.
Define the reconciliation vectors
Through AI-aided analysis of the data structures, the Financial Reconciliation agent automatically suggests reconciliation vectors by providing mapping and monetary keys. Those keys are shown on the Keys card.
You can use the vectors that the Financial Reconciliation agent suggests or user-selected vectors.
To define the reconciliation vectors, follow these steps.
Review the agent-suggested rules, and select one of the following actions:
- Keep – Accept the suggestions to formalize the suggested list and put the vector selection into edit mode. If you select Keep, you can add user-selected keys to the list or replace keys for vectors that the Financial Reconciliation agent suggested.
- Regenerate (the circular arrow symbol next to Keep) – Rerun the data structure analysis to make the agent suggest other possible sets of columns.
- Remove all suggestions (the delete symbol next to Regenerate) – Clear all suggested vectors, and start to add user-selected mapping and monetary keys individually. Alternatively, select the Finance agents suggestions button to instruct the Financial Reconciliation agent to generate a list of suggested keys.
In edit mode, select Add to add vectors, and then select a type (mapping or monetary key). A pair of parameters, one for each source table in the reconciliation, is added to the list of keys.
Use the dropdown list to select the columns from the source tables to use for the key. You must complete this process for each pair of parameters.
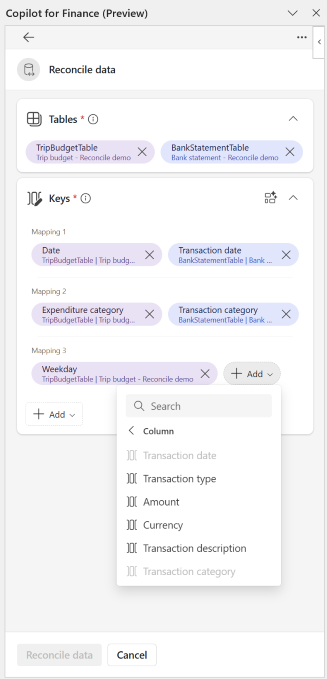
Remove any unwanted columns as you require.
To enable support for a wide variety of use cases, a selection of modifiers is provided for mapping and monetary keys. Modifiers can be set for each key and expand the matching range. Learn more in Use partial matching in data reconciliation, Use tolerances in data reconciliation, and Match without using a monetary key in data reconciliation.
You can add optional reference columns from the source tables to provide more context and help you review transactions on the reconciliation report. These columns aren't used to generate matching results. They can't be existing mapping or monetary key columns. Learn more in Use reference columns in reconciliation reports.
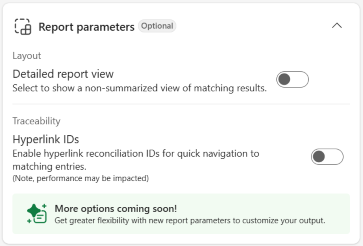
By default, the reconciliation report is provided in a summarized view that shows all data relationships (one-to-one, one-to-many, many-to-many, and many-to-one) in single-line summaries. There's a detailed view that shows each transaction of a data relationship. In the detailed view, related transactions are clustered together, and each cluster is separated by blank rows. To open the detailed view, select the Report parameters card, and turn on the Detailed report view option. (Learn more about reports in the Reconciliation report section of this article.)
After you finish defining all options and parameters, select Reconcile data to start the data reconciliation process.
Note
You can change the setting of reconciliation parameters at any time after a reconciliation is performed. Select the Keys card to expand the view, edit the mapping keys, and then select Re-reconcile data.
Use the Reconciliation report
The reconciliation report shows the results of the reconciliation process.

All transactions are compared according to the defined parameters and classified into three categories:
Unmatched transactions
- "Discrepancy Unmatched": Mapping keys match, but there's a discrepancy in monetary values.
- "Exclusively Unmatched": The transaction doesn't have a corresponding match in the other table.
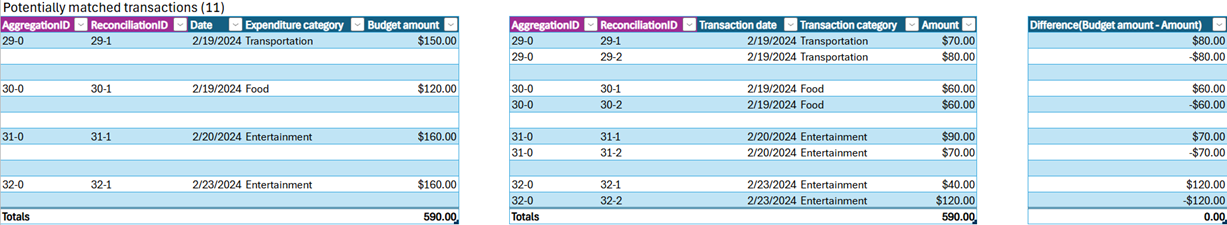
Potentially matched transactions
- Mapping keys and monetary values match, but more than one transaction in one or both data sets sums up to the matched monetary values. All one-to-many (1:N), many-to-one (N:1), and many-to-many (N:N) combinations are shown.
Matched transactions (perfectly matched)
- Values in all selected columns that were given as reconciliation parameters match for a single transaction in each table.
By default, the reconciliation report is provided in a summarized view that shows all data relationships in single-line summaries.

There's a detailed view that shows each transaction in grouped clusters that are separated by blank rows.
Traceability
To support the need for traceability and troubleshooting, aggregation and reconciliation IDs are added to the reconciliation report. These identifiers are traceability-related capabilities that link individual pieces of transaction data from source data tables to the reconciliation output. These identifiers let you more easily search and trace the ___location of a transaction or aggregated transactions, regardless of whether the transaction goes from the reconciliation report to the original source data, or from the original source data to the reconciliation report. The IDs also let users take advantage of existing Excel capabilities, such as search, filtering, and sorting. After you perform a reconciliation, the following events occur:
A reconciliation report is created. This report uses the following identifiers:
Aggregation ID — The default summarized view of the reconciliation report includes aggregation IDs. An aggregation ID is an identification number that links all the related transactions in one table to the matching related transactions of another table. Therefore, it helps identify 1:N, N:N, and N:1 relational scenarios. The aggregation ID always has "-0" appended to the unique ID to distinguish it from the reconciliation ID that is assigned to individual transactions.
Reconciliation ID — A reconciliation ID is assigned to each transaction. Reconciliation IDs always have a nonzero value appended to them ("-1," "-2," and so on). The nonzero value increases to reflect the number of transactions that are in a related set. Reconciliation IDs don't appear in the default summarized view of the reconciliation report, because that view shows only the summarized aggregate transactions, not the individual transactions. However, reconciliation IDs appear in the detailed view, which shows all transactions. To facilitate traceability, Reconciliation IDs can be hyperlink-enabled. (Hyperlinks are disabled by default.)
From the newly created copy of a source worksheet ("…_reconciled"), selecting the reconciliation ID of a transaction redirects the user to the exact ___location of the transaction on the reconciliation report. If the reconciliation report is currently displaying a summary view, the user is directed to the aggregated transaction. If the reconciliation report is in detailed view, the link takes the user to the individual transaction.
From the detailed view of the reconciliation report, selecting the Reconciliation ID redirects the user to the ___location of the individual transaction on the created copy of a source worksheet ("…reconciled").
To enable hyperlinks, navigate to the Report Parameters card and select the Hyperlink IDs toggle. (Note, the generation of hyperlinks can effect performance by extending the time it takes to produce a reconciliation report, particularly in large datasets.)
New copies of each source worksheet are created. The new copies have "_reconciled" appended to their name. Each copied source worksheet includes three added columns: Aggregation ID, Reconciliation ID, and Reconciliation Result that indicates the outcome (___location) of the transaction after performing the reconciliation.
Report summary
Generative AI analyzes the reconciliation results. Based on the transaction types, it generates a report summary that provides insights and suggestions for addressing inconsistencies.
To rerun the generative AI–driven analyses of the reconciliation report and generate a new summary, select Regenerate on the Insights card.
To generate a downloadable PDF version of the report summary, select Save as PDF (the down arrow symbol in the upper-right corner of the Insights card).
Note
To view a PDF of the reconciliation report on the screen, use the Print to PDF function in Excel.
Use suggested actions
After a report summary is generated, you can use a suggested action.
To copy the summary that is available in the sidecar and add it to the body of the report, select Append summary to report.
To get transaction details together with a troubleshooting guide for a single row of a reconciliation report, select Troubleshoot transactions.
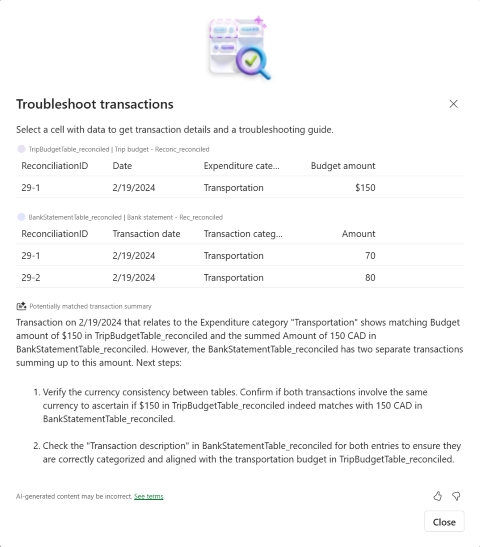
Use the Troubleshoot transactions feature
You can use the Troubleshoot transactions feature of the Financial Reconciliation agent to investigate transactions in the unmatched and potentially matched sections of the reconciliation report.
Troubleshoot transactions generates a guide that includes the following information.
All related transactions from each data source that are displayed in the unmatched or potentially matched sections of the reconciliation report. Related transactions are connected through their Aggregation and Reconciliation IDs. Learn more about aggregation and reconciliation IDs in the Traceability section of this article.
An AI-generated explanation as to why the results are classified as unmatched or potentially matched.
Suggestions for Next Steps you can take to resolve the results on the report.
Note
Some transactions in the unmatched section can be related if they are considered "Discrepancy Unmatched", see Discrepancy Unmatched in Unmatched transactions.
To use Troubleshoot transactions, follow these steps.
From the Insights card, select Troubleshoot transactions.
In the unmatched or potentially matched sections of the reconciliation report, select any cell with data to get transaction details and a troubleshooting guide.
Select Close to return to the Report summary page.